


SECTORAL INDICES ROTATION WATCH [FOR JULY 2023]
WHICH SECTORS ARE LEADING AND WHICH ONES ARE LAGGING; WHICH ARE HOT AND WHICH ARE NOT!


OVERVIEW
Passive investing is a style which has a huge fan following across the world. The basic premise is that you don’t need to always be active in the market, and can generate good returns even if you invest passively. One of the things that works extremely well is the low-cost aspect in passive investing. Needless to say, this works best if one employs Exchange Traded Funds (ETFs).
However, I have found that there are two basic issues with this recommended style:
It advocates people to keep buying and averaging out. I am against the basic concept of averaging down on any asset (why put more money in a losing asset!).
It also advocates for holding an ETF for years together. Again, if its on a downtrend, what is the point of holding it for years.
I have re-worked the above approach on Passive Investing and have added my own modifications to it, and have tried-and-tested this on one of my own accounts. Here, I track the different sectors and keep a watch for which ones are on an uptrend and which ones are on a downtrend. And, I try to take advantage of this information by using sector rotation and positioning myself with the winning ones. The winning ones are usually the ones which also have an institutional footprint.
A good and strong sector is a wonderful tailwind to have!
ANALYSIS
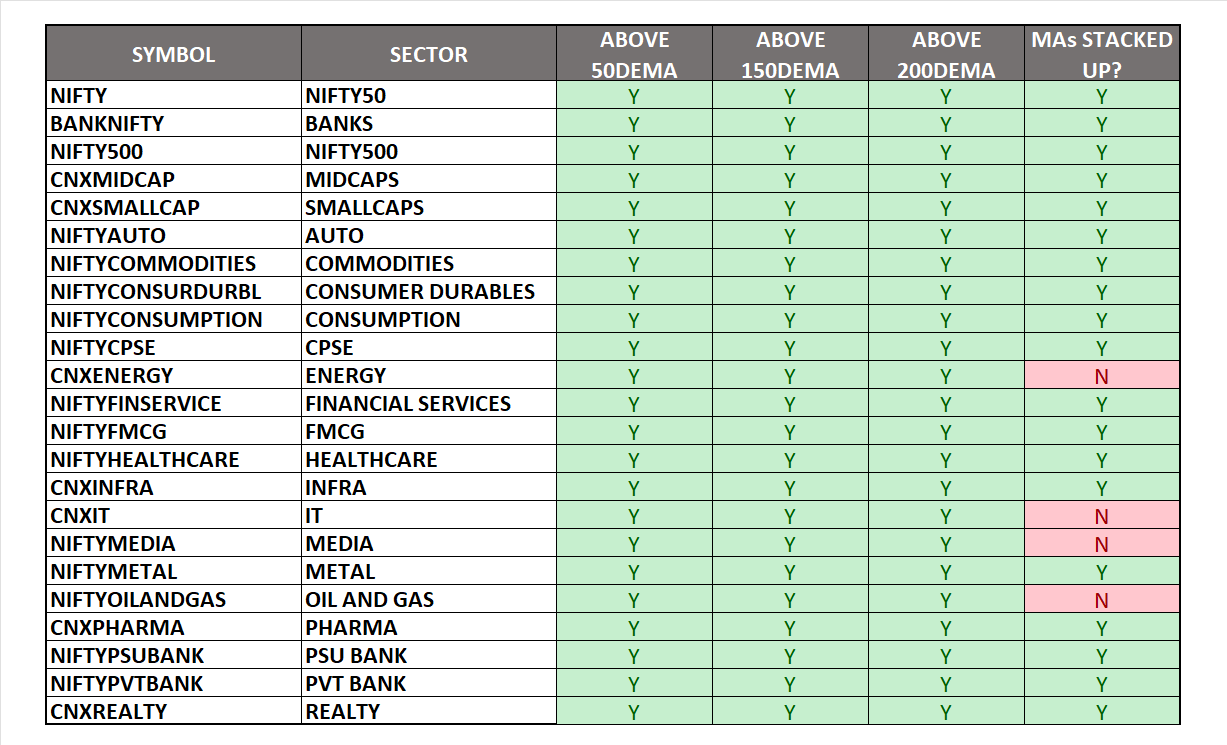
Let’s look at the how the various sectoral indices are doing and then we can derive which ones are doing well and which ones are not. This will allow us to look at the respective ETFs for the coming month.
I prefer to rank the sectors into 3 categories as follows:
A: Good For Deployment
B: Under Watch
C: Avoid / Book Profits
Let’s dive in!
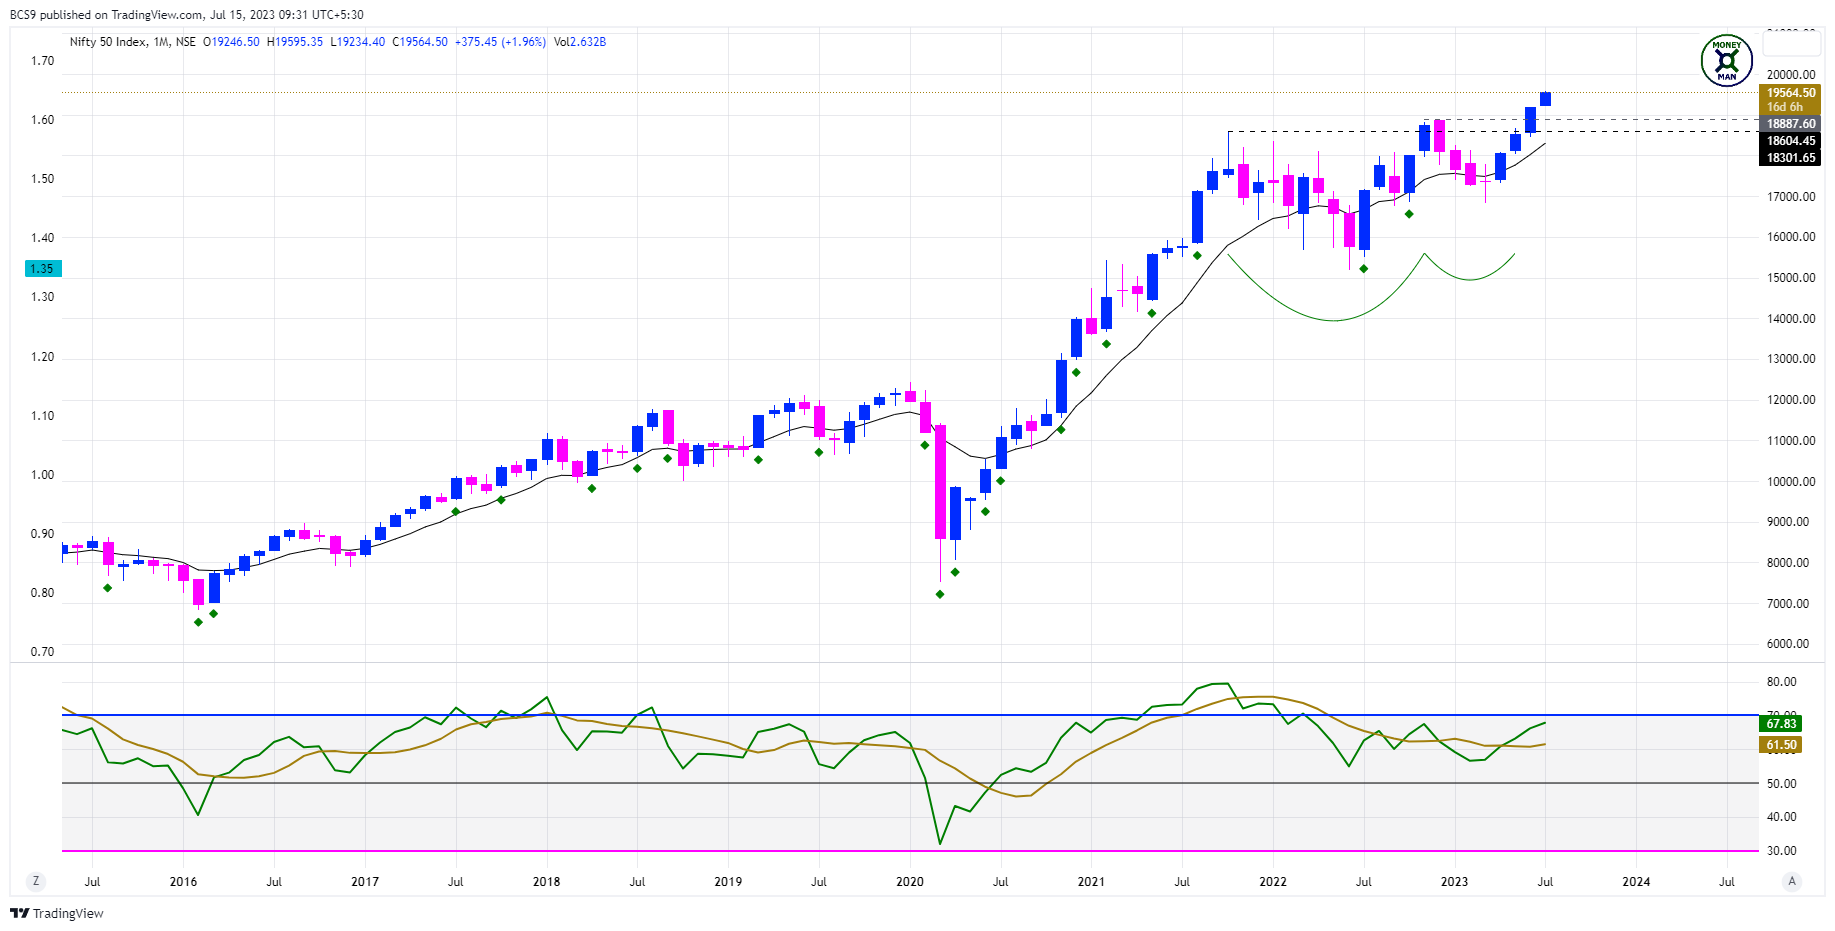
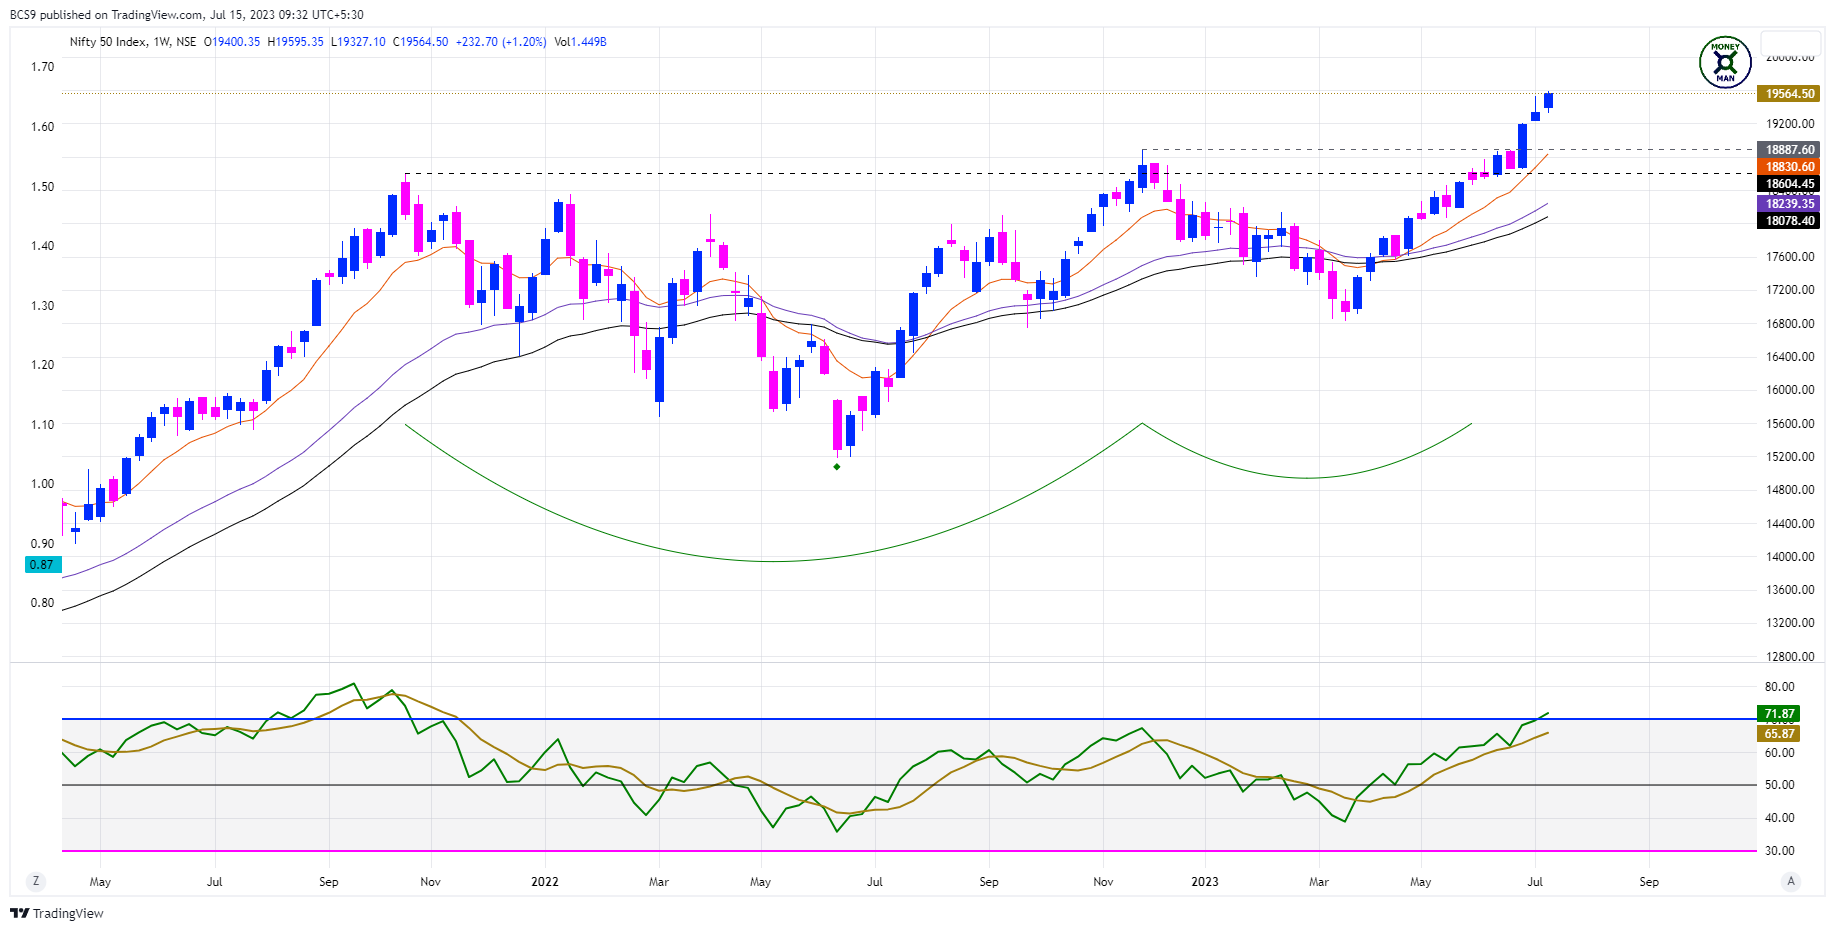
1. NIFTY
MONEYMAN TREND GUIDE:
Breakout above Consolidation Base: YES
Good Buying Momentum: YES
Stage 2 Advancing Phase: YES
At / Near ATH: YES
At / Near 52 Week Highs: YES
Price Action Structure: HH-HL
OBSERVATIONS:
In an uptrend. Broken out of base. Weekly RSI over-bought. Move getting slightly extended.
FINAL RANKING: B
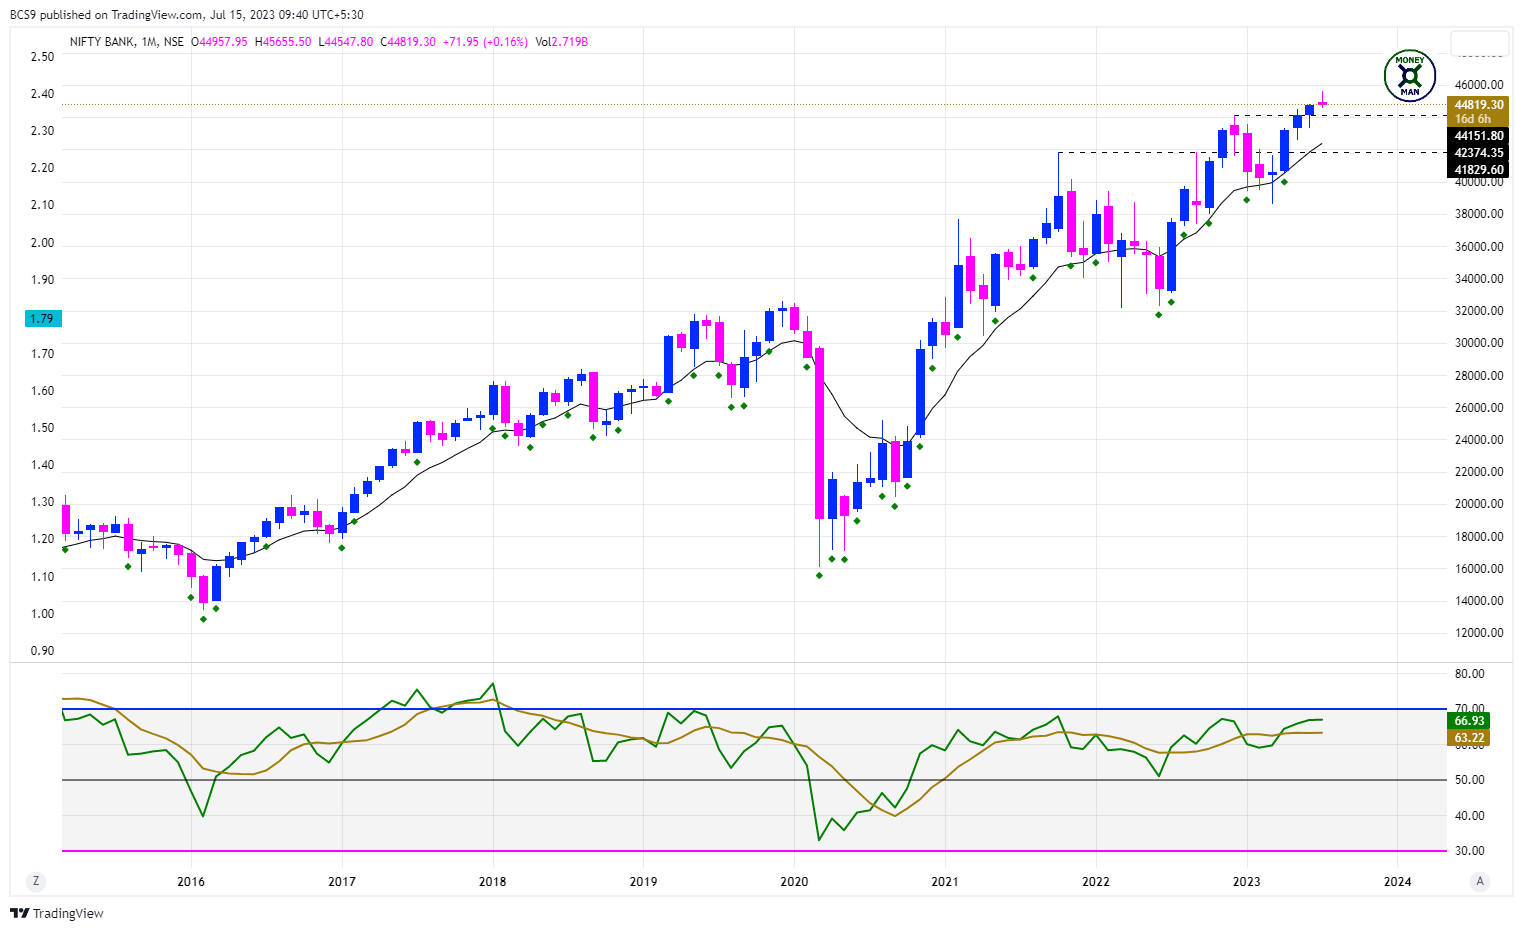
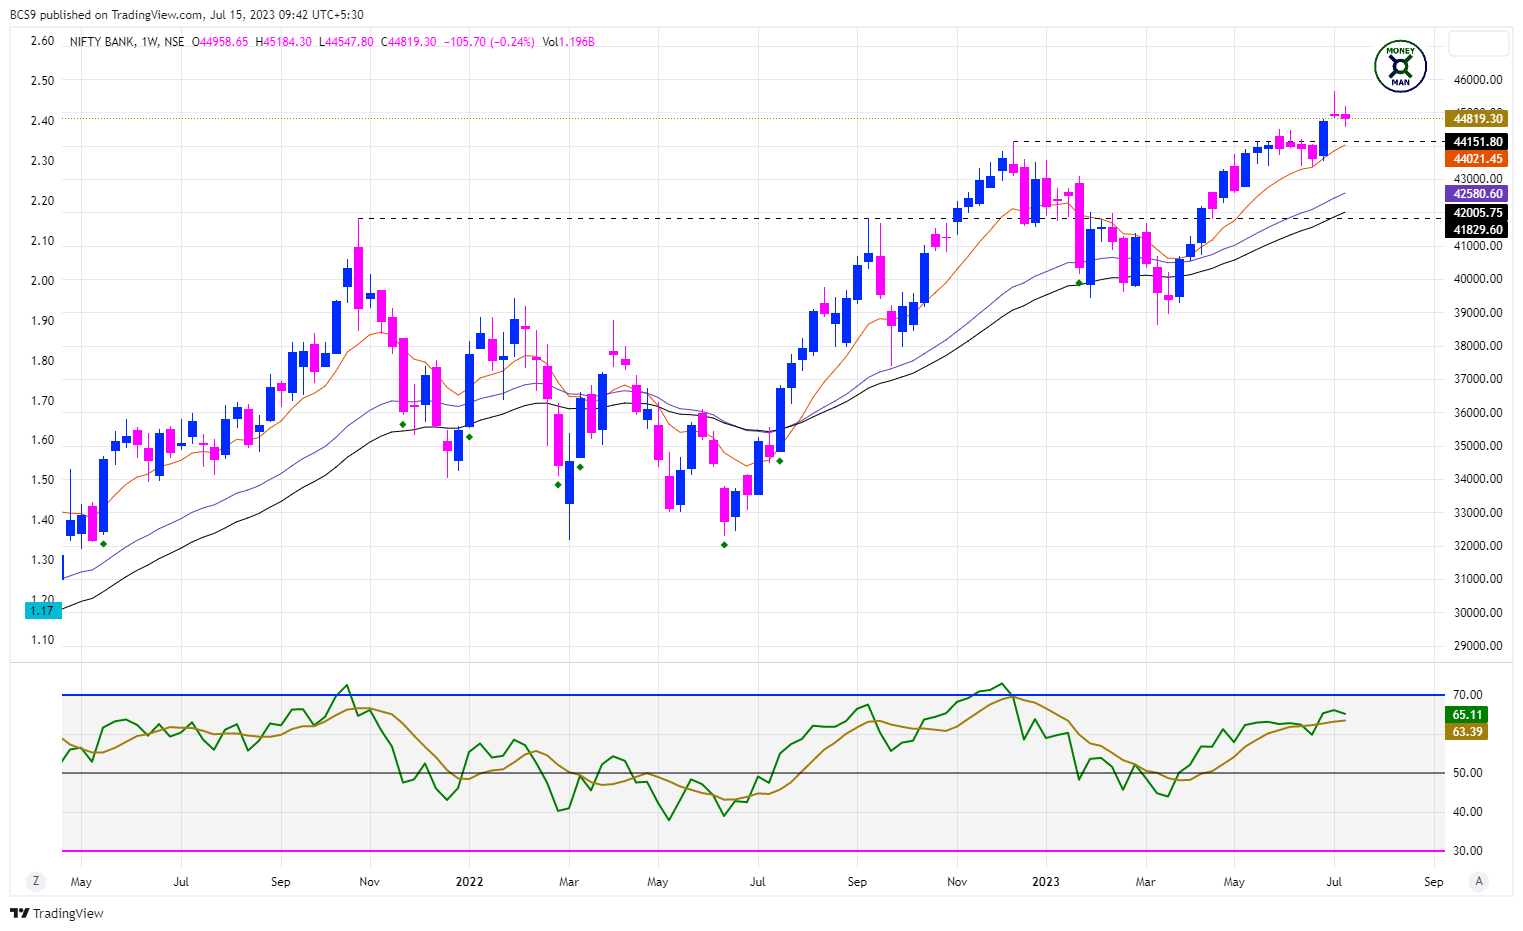
2. BANKNIFTY
MONEYMAN TREND GUIDE:
Breakout above Consolidation Base: YES
Good Buying Momentum: YES
Stage 2 Advancing Phase: YES
At / Near ATH: YES
At / Near 52 Week Highs: YES
Price Action Structure: HH-HL
OBSERVATIONS:
Uptrend. Has broken out of base.
FINAL RANKING: A
3. NIFTY500
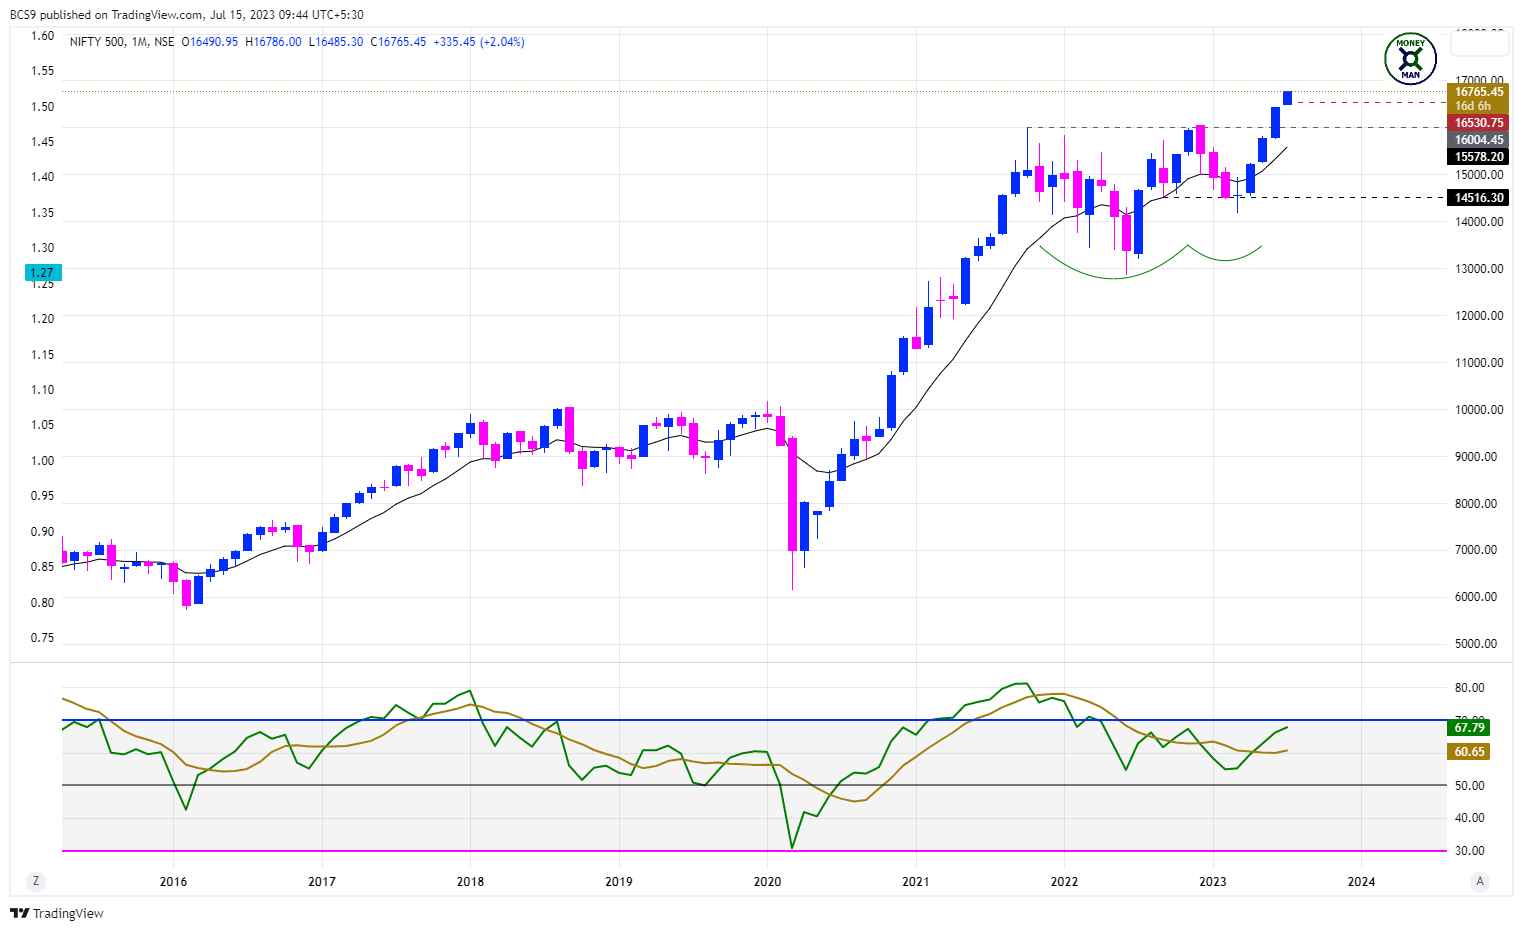

MONEYMAN TREND GUIDE:
Breakout above Consolidation Base: YES
Good Buying Momentum: YES
Stage 2 Advancing Phase: YES
At / Near ATH: YES
At / Near 52 Week Highs: YES
Price Action Structure: HH-HL
OBSERVATIONS:
In an uptrend. Broken out of base. Weekly RSI over-bought. Move getting slightly extended.
FINAL RANKING: B
4. NIFTY MIDCAPS
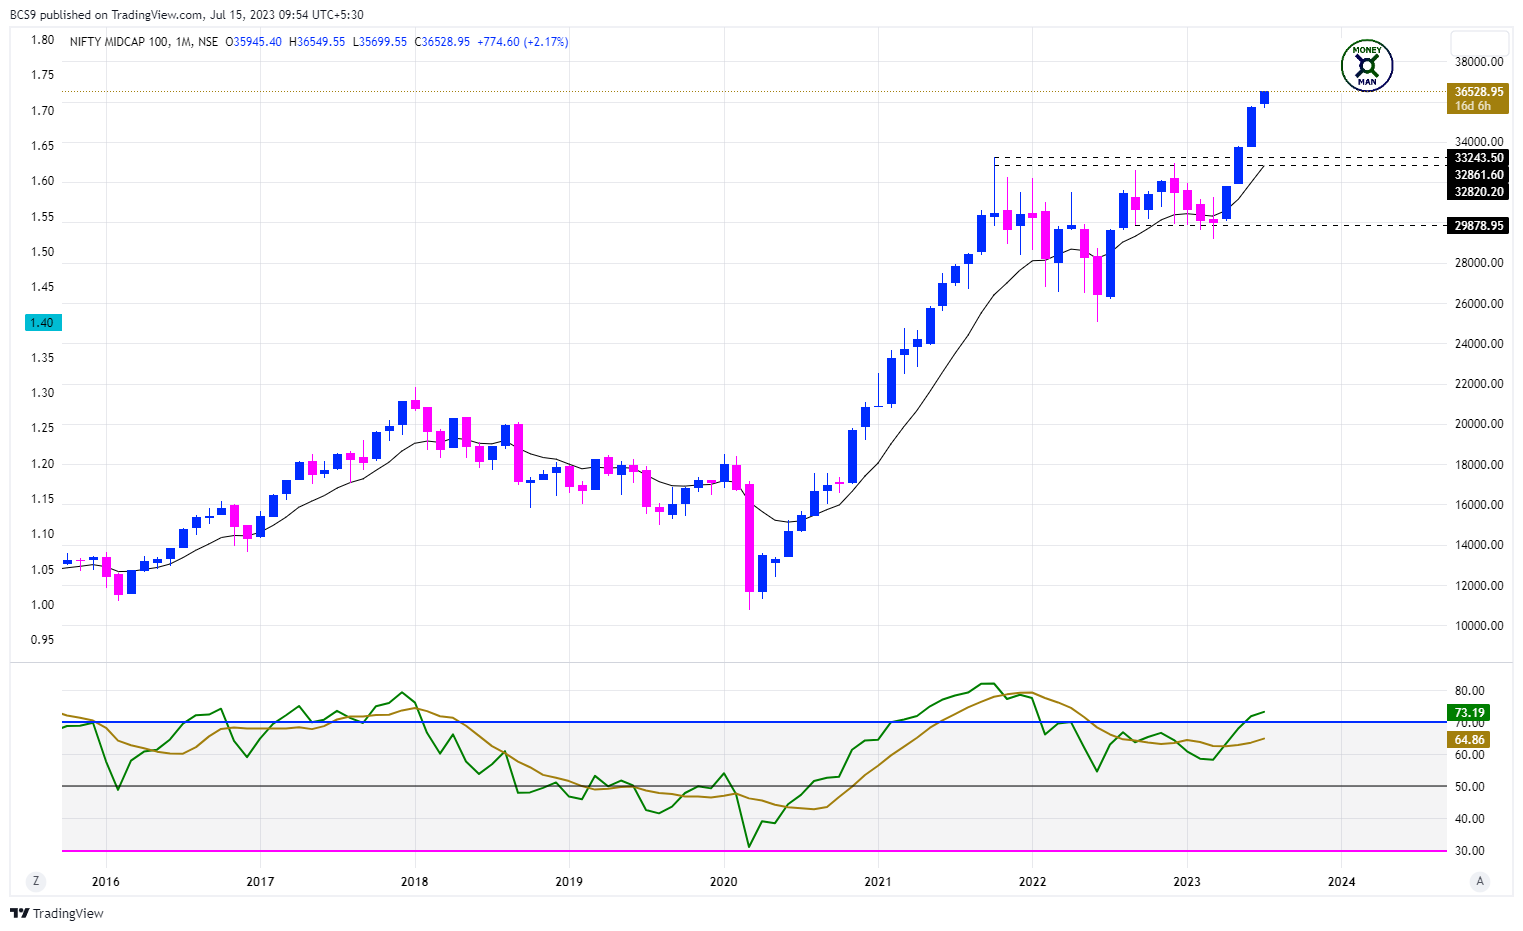

MONEYMAN TREND GUIDE:
Breakout above Consolidation Base: YES
Good Buying Momentum: YES
Stage 2 Advancing Phase: YES
At / Near ATH: YES
At / Near 52 Week Highs: YES
Price Action Structure: HH-HL
OBSERVATIONS:
Strong uptrend. Broken out of base. Weekly & Monthly RSI over-bought. Move getting slightly extended.
FINAL RANKING: B
5. NIFTY SMALLCAPS
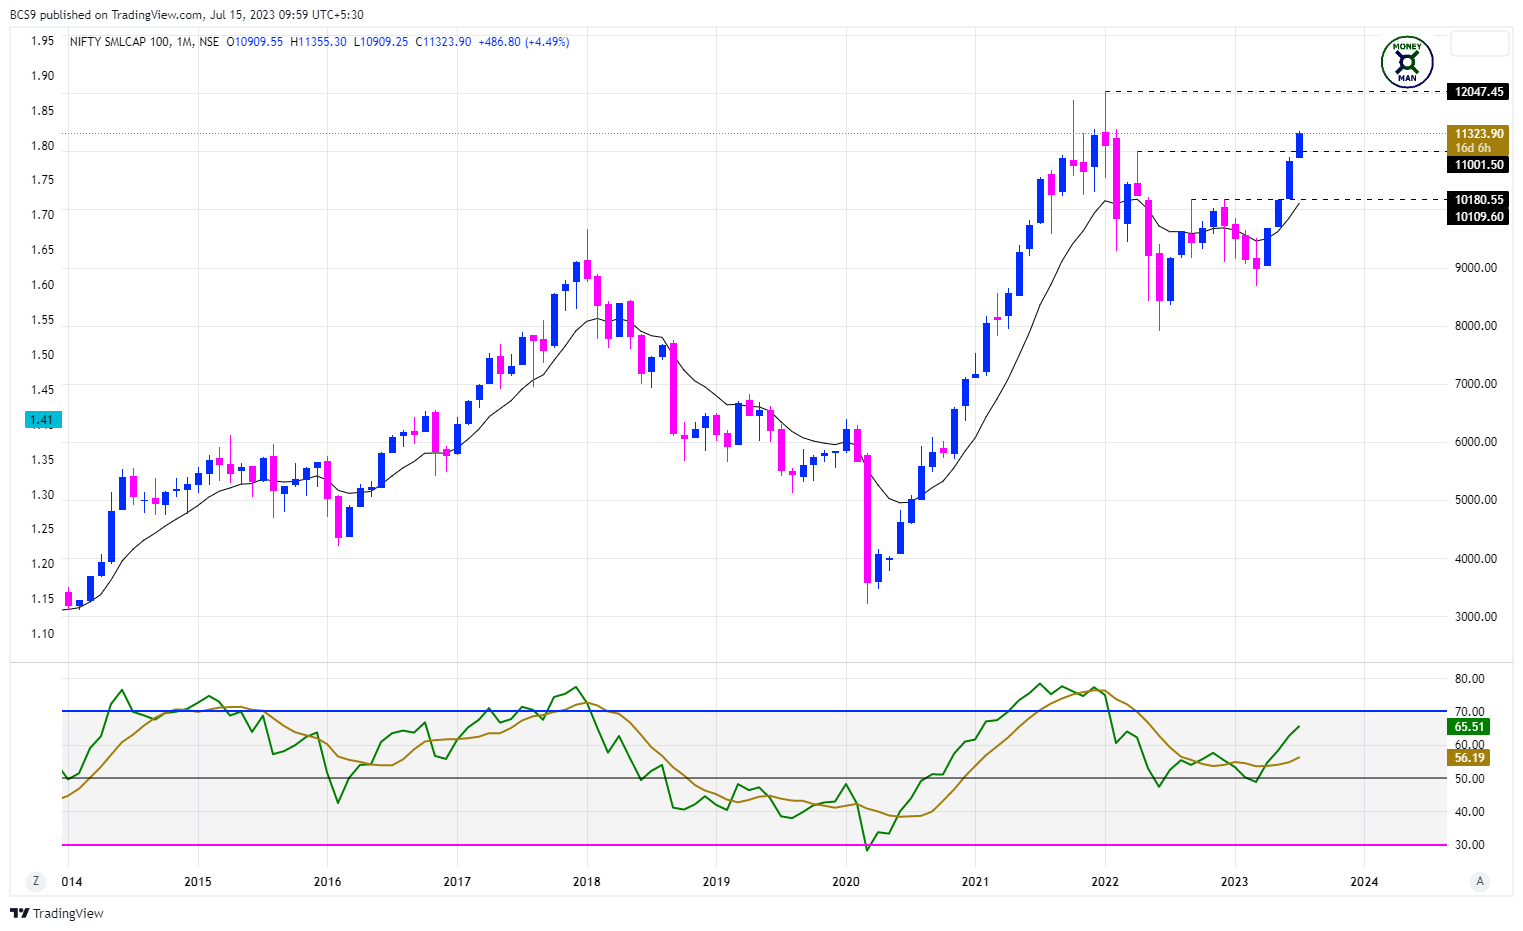
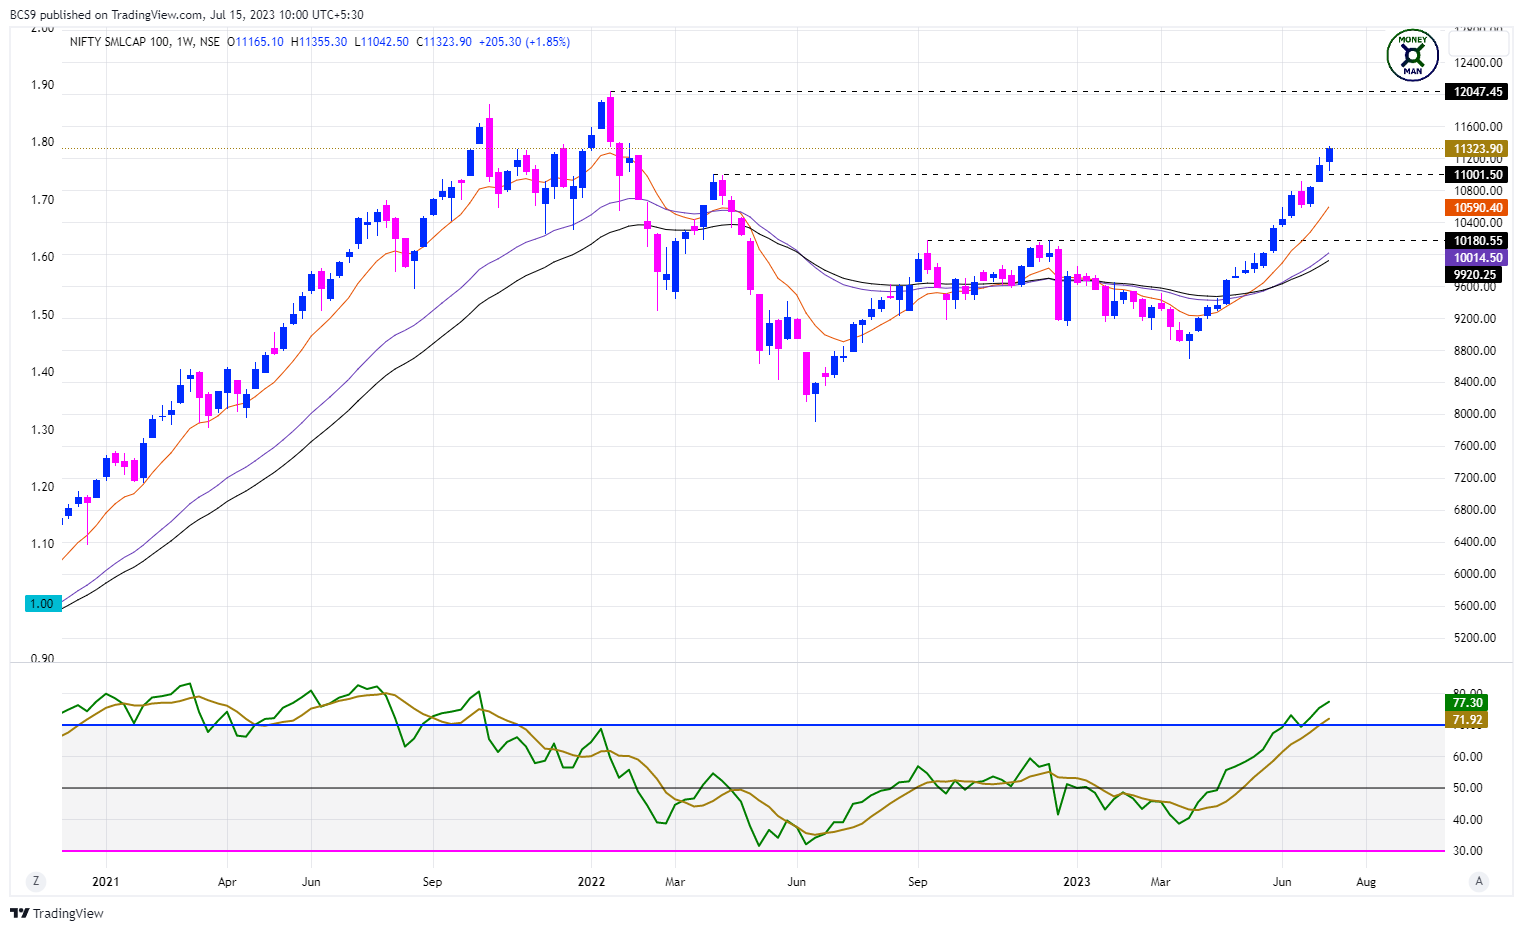
MONEYMAN TREND GUIDE:
Breakout above Consolidation Base: YES
Good Buying Momentum: YES
Stage 2 Advancing Phase: YES
At / Near ATH: NO
At / Near 52 Week Highs: YES
Price Action Structure: HH-HL
OBSERVATIONS:
Strong uptrend. Broken out of base. Weekly RSI over-bought but looks like making new highs. Move getting slightly extended.
FINAL RANKING: B
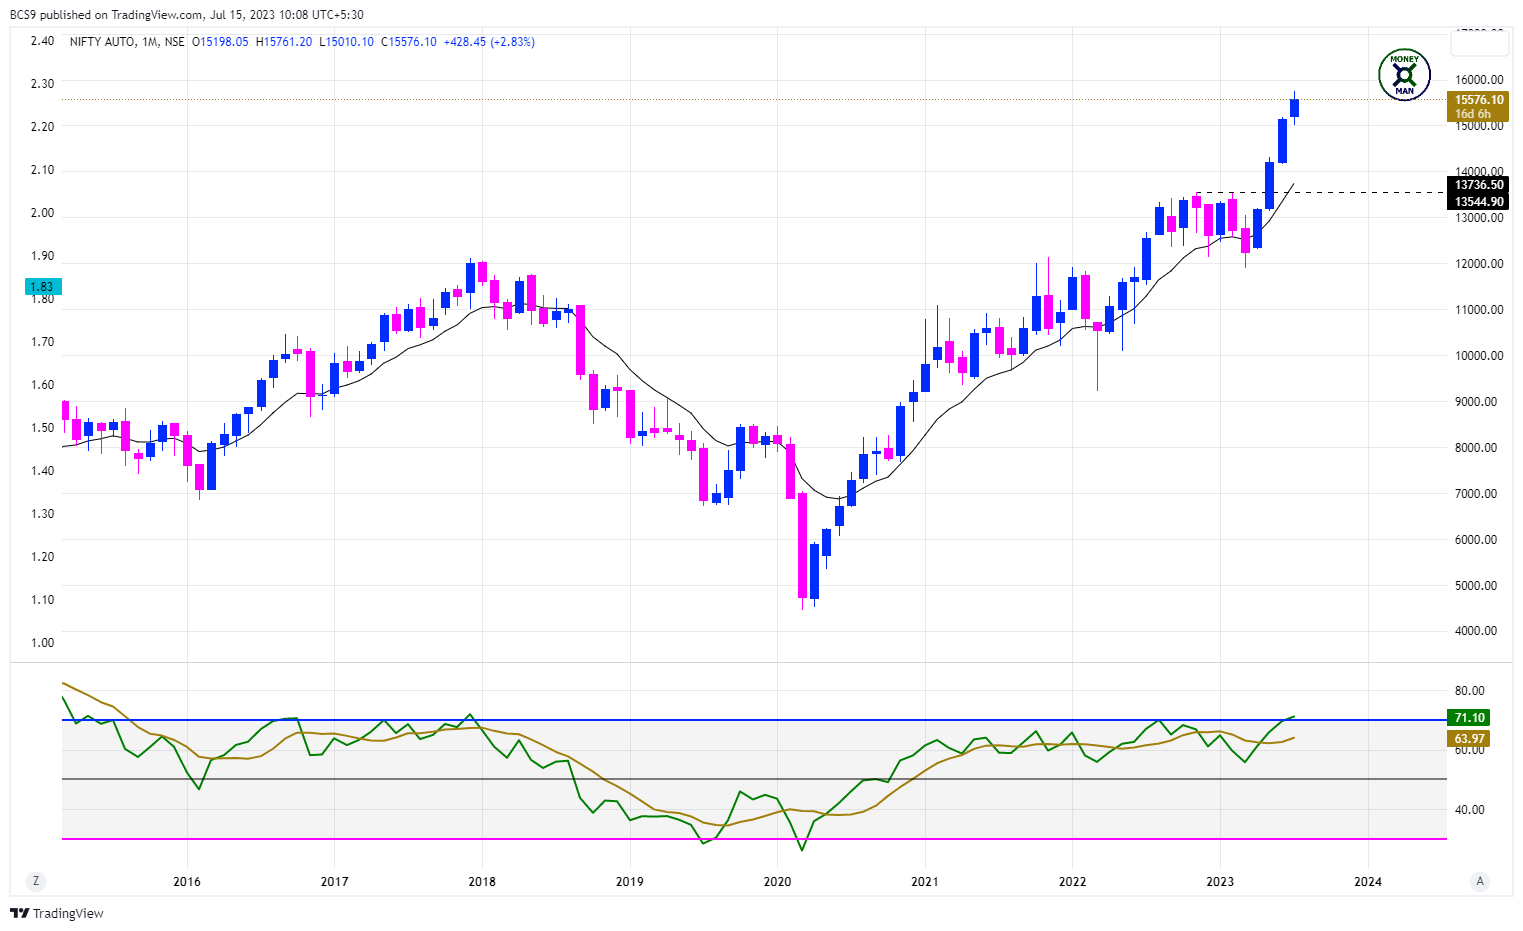
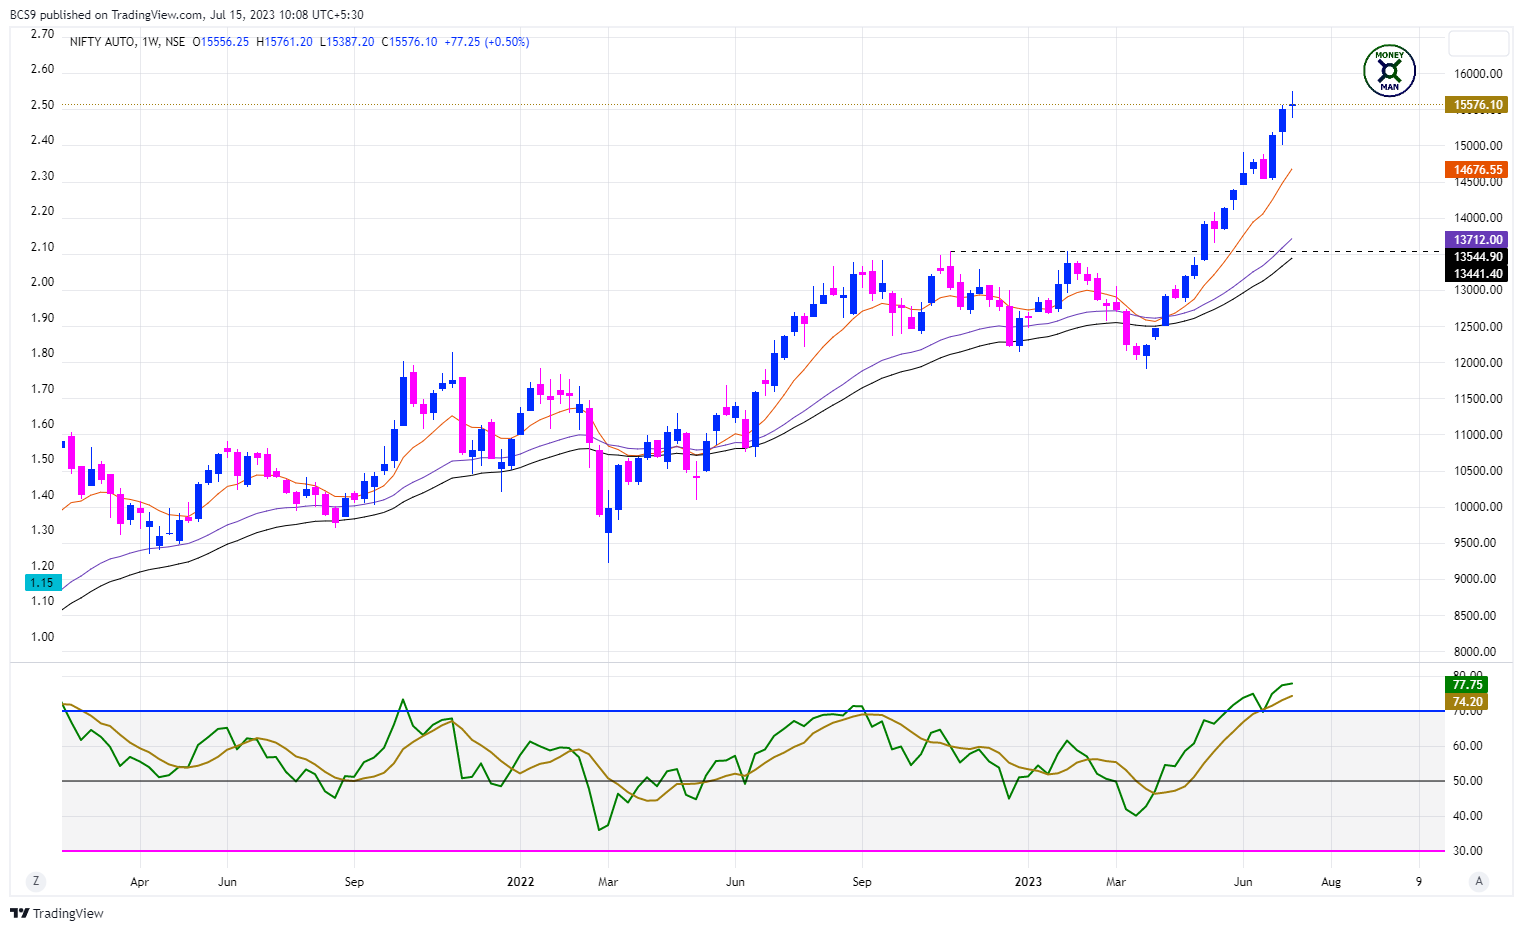
6. NIFTY AUTO
MONEYMAN TREND GUIDE:
Breakout above Consolidation Base: YES
Good Buying Momentum: YES
Stage 2 Advancing Phase: YES
At / Near ATH: YES
At / Near 52 Week Highs: YES
Price Action Structure: HH-HL
OBSERVATIONS:
Strong Uptrend. Weekly & Monthly RSI getting into Over-bought zone but weekly RSI has made new highs. Moves getting extended.
FINAL RANKING: C
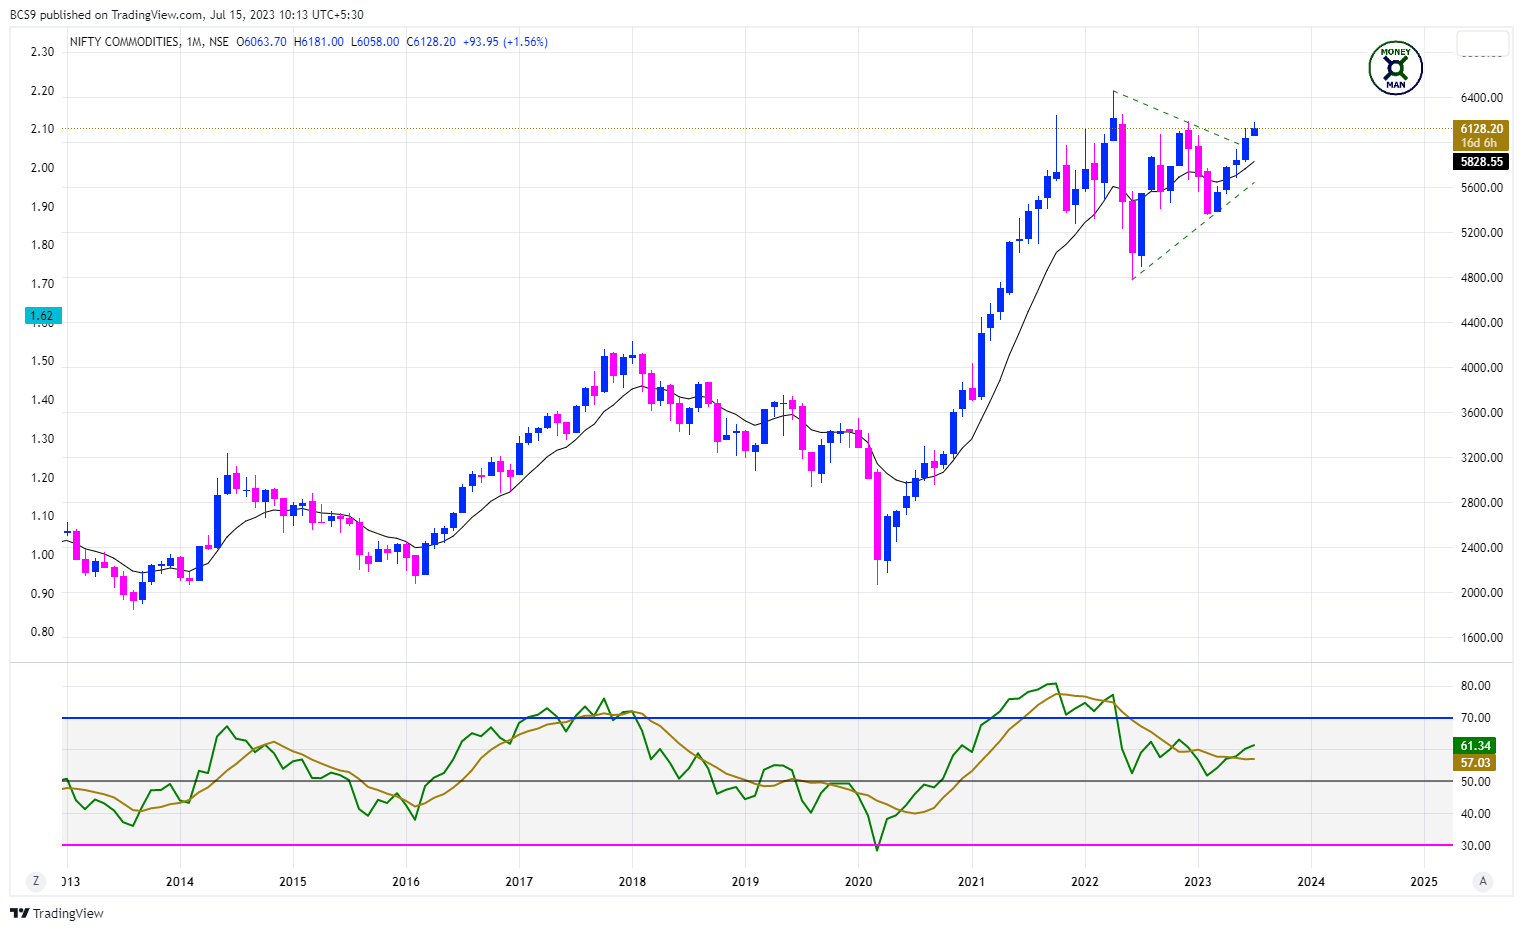
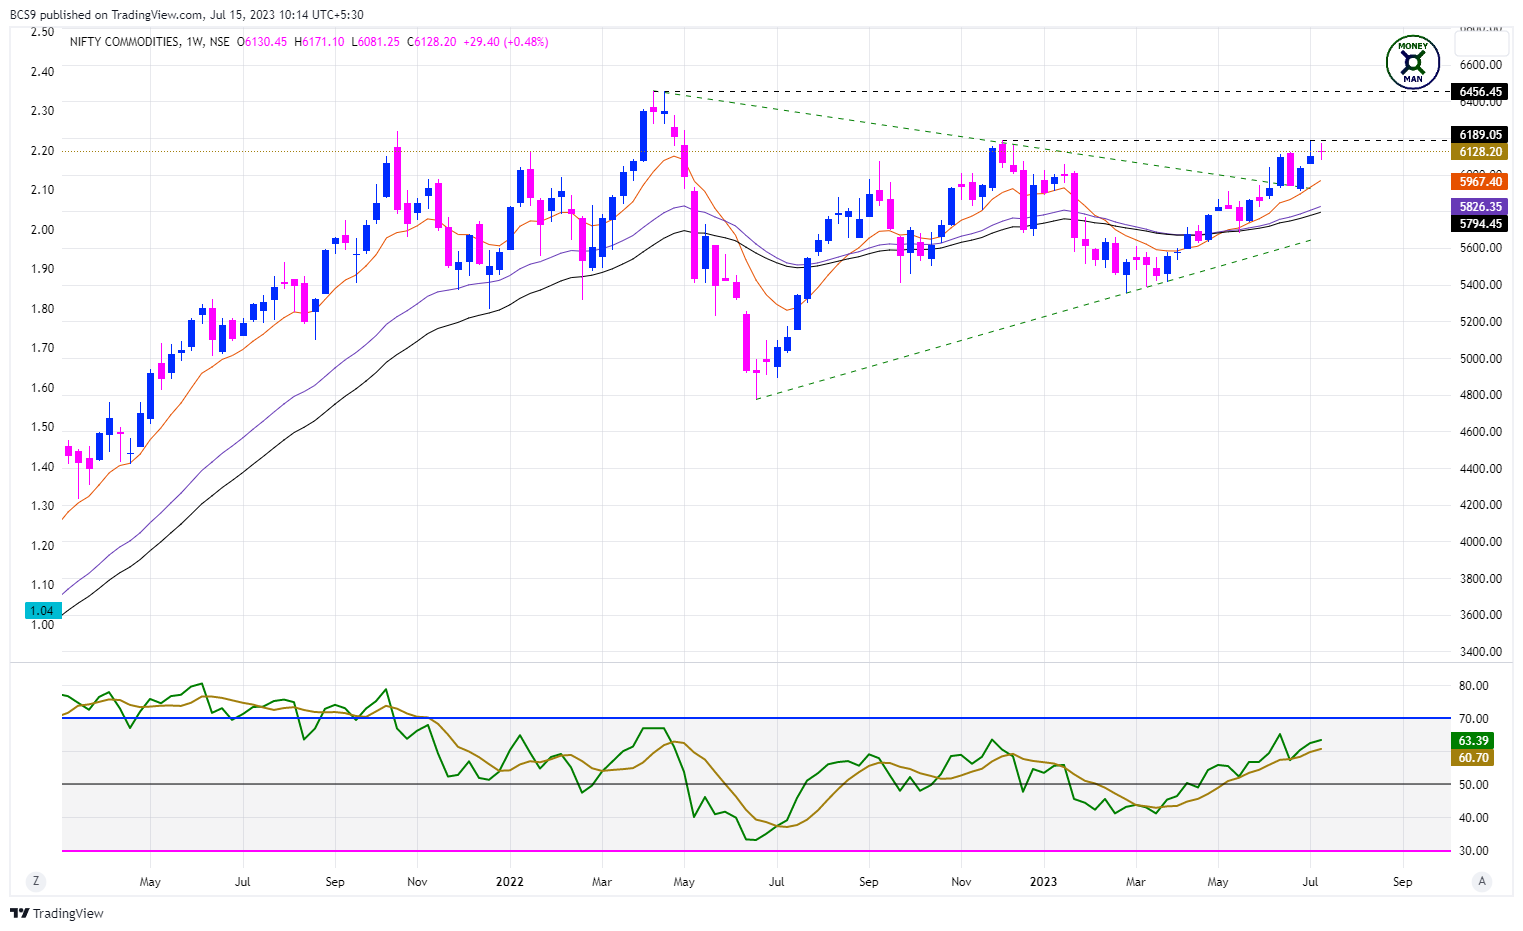
7. NIFTY COMMODITIES
MONEYMAN TREND GUIDE:
Breakout above Consolidation Base: YES
Good Buying Momentum: YES
Stage 2 Advancing Phase: YES
At / Near ATH: NO
At / Near 52 Week Highs: YES
Price Action Structure: HH-HL
OBSERVATIONS:
Broken out of consolidation triangle. Could also be considered as a Pole & Pennant on monthly TF.
FINAL RANKING: A
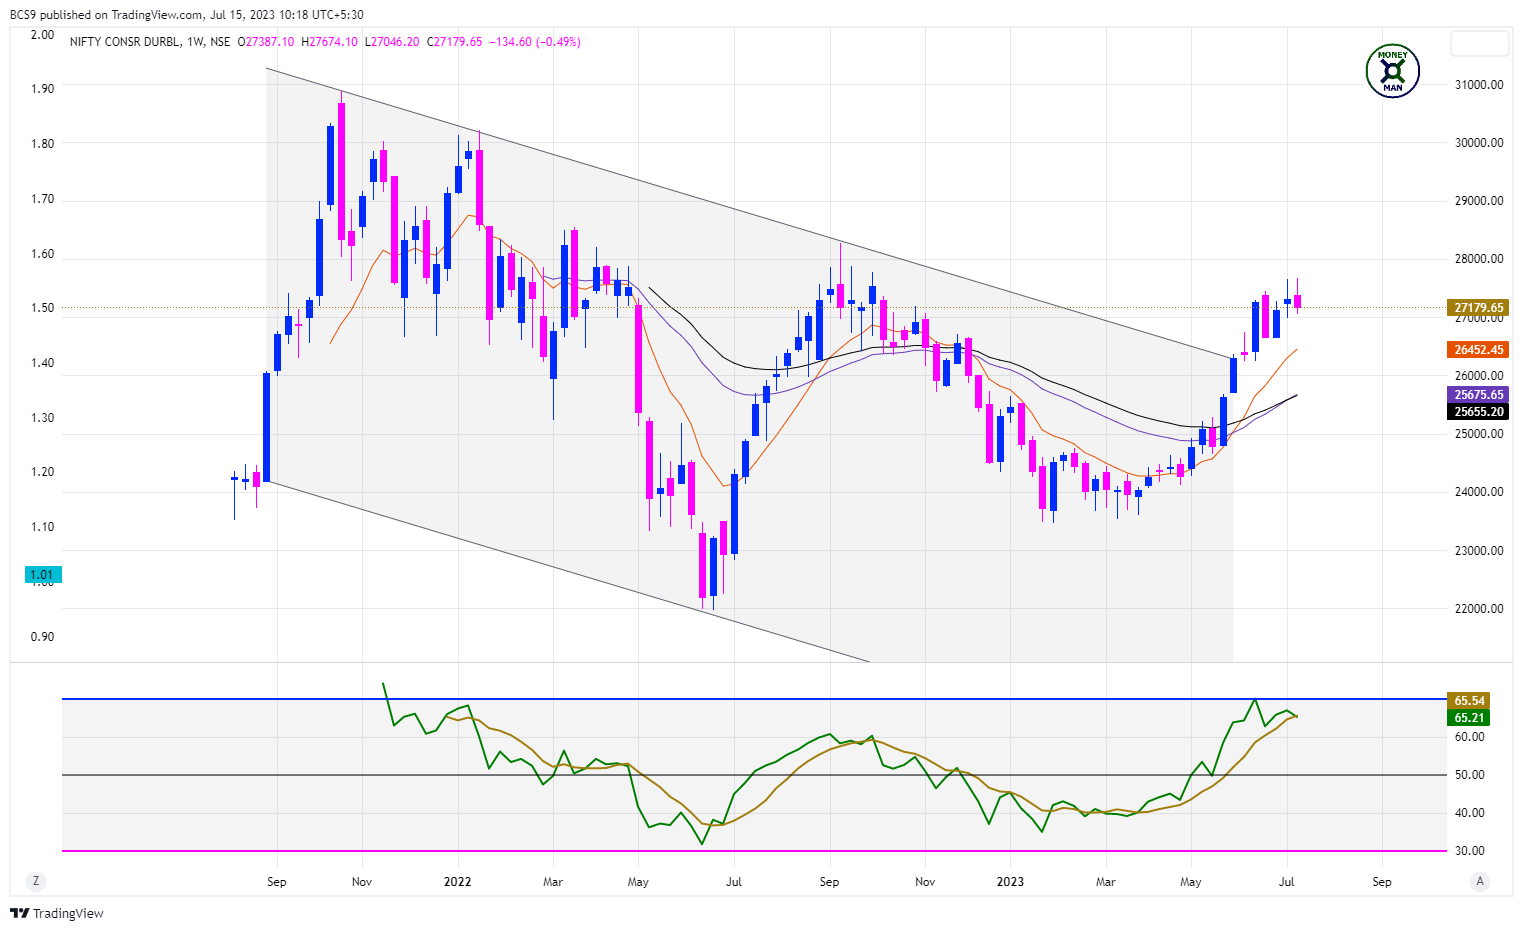
8. NIFTY CONSUMER DURABLES
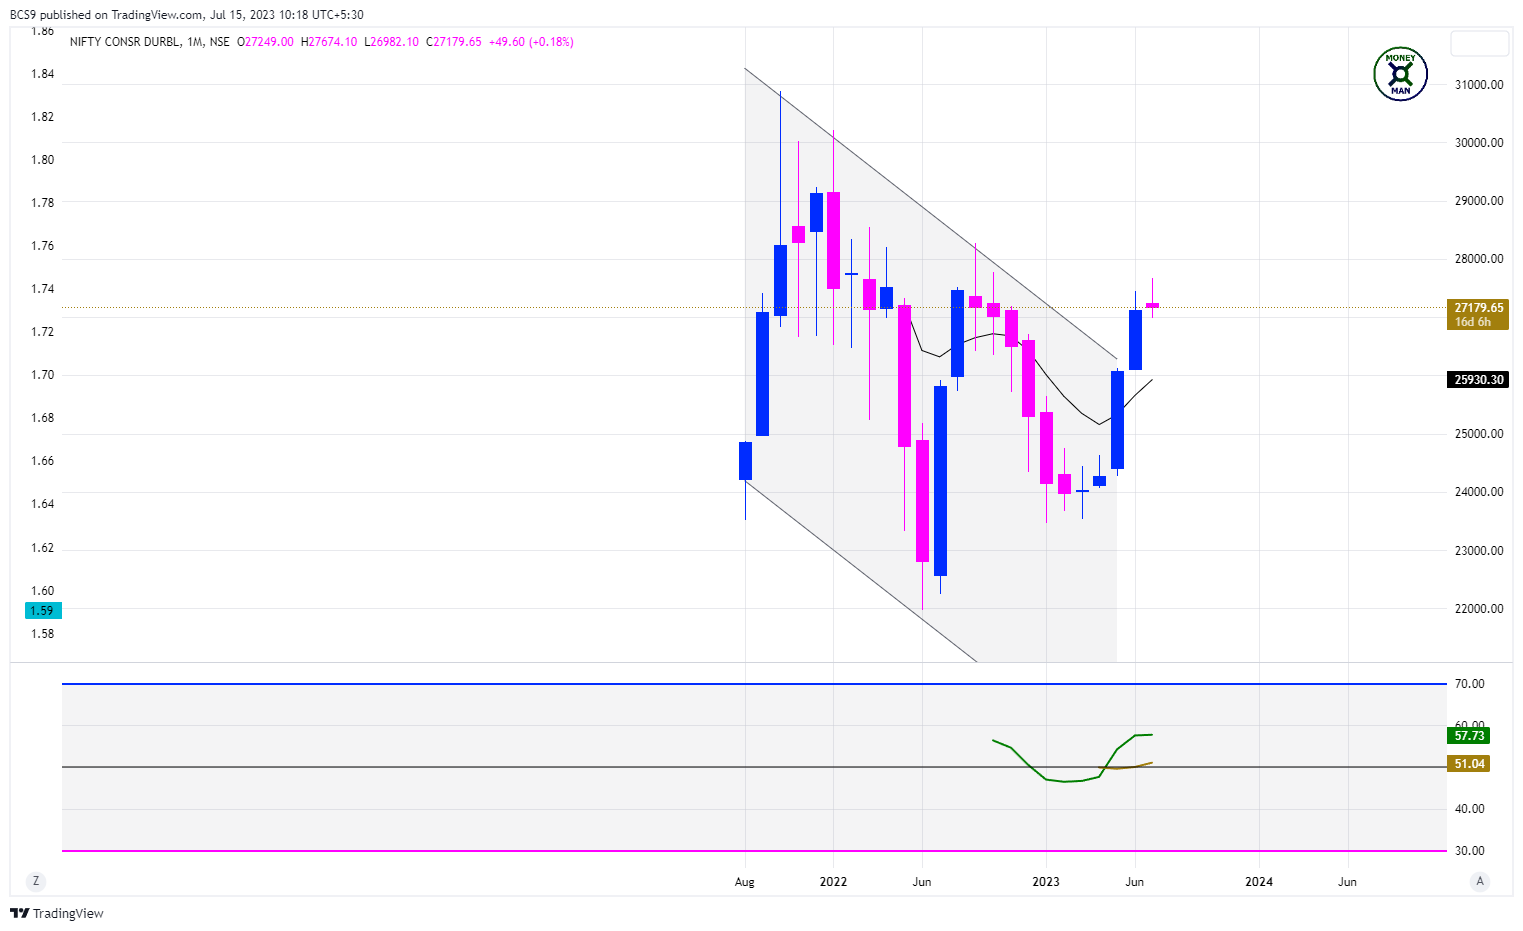
MONEYMAN TREND GUIDE:
Breakout above Consolidation Base: YES
Good Buying Momentum: YES
Stage 2 Advancing Phase: YES (EARLY)
At / Near ATH: NO
At / Near 52 Week Highs: NO
Price Action Structure: HH-HL
OBSERVATIONS:
Has just given a multi-year breakout.
FINAL RANKING: A
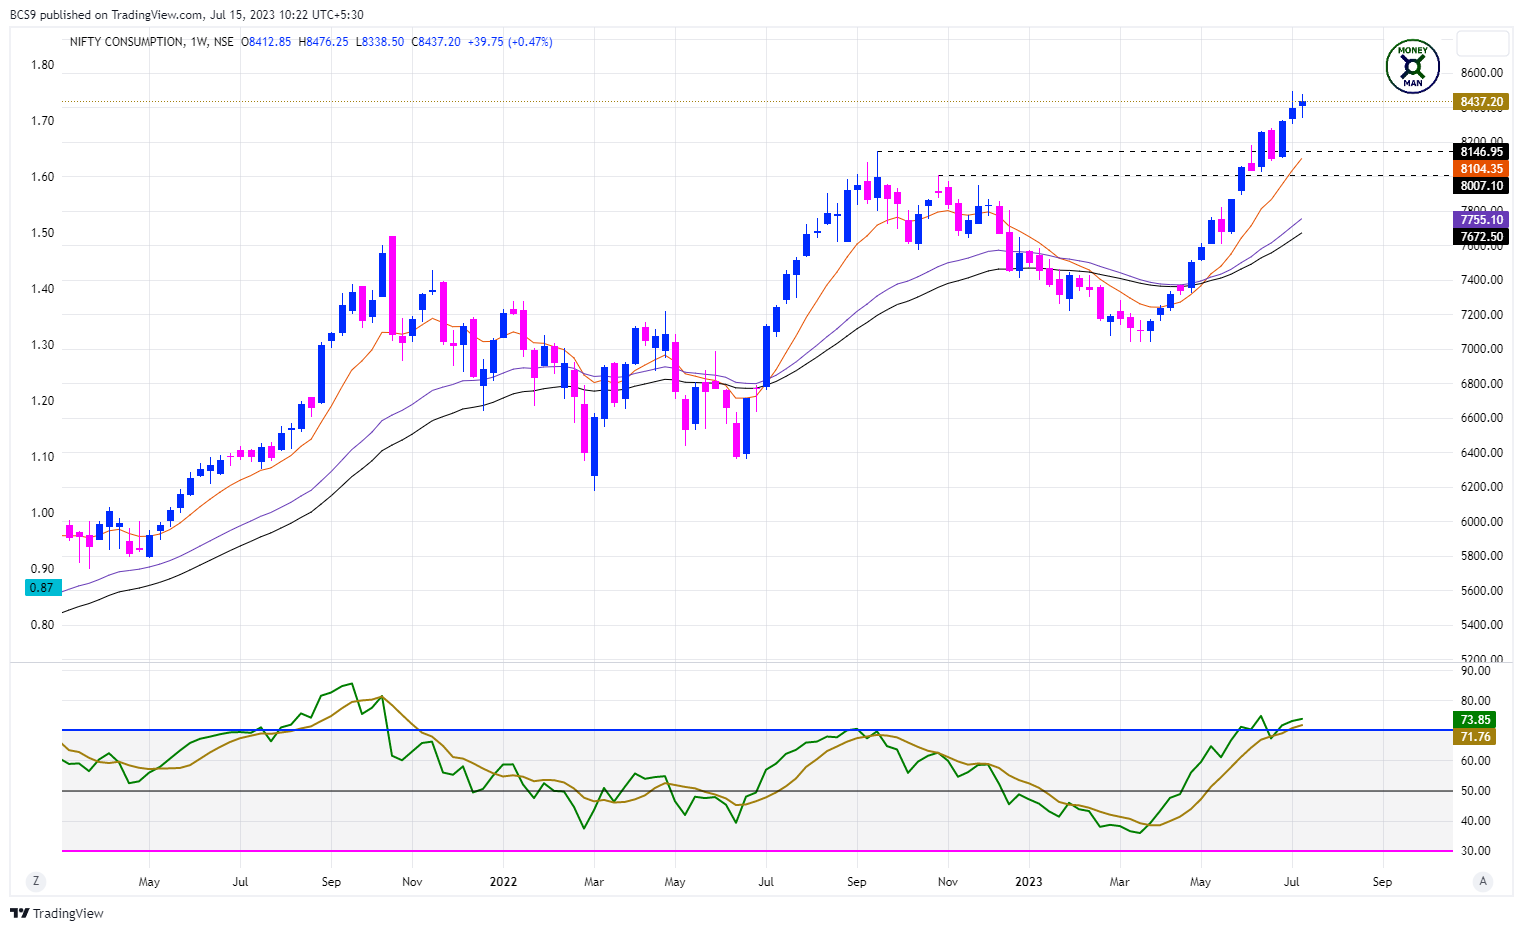
9. NIFTY CONSUMPTION
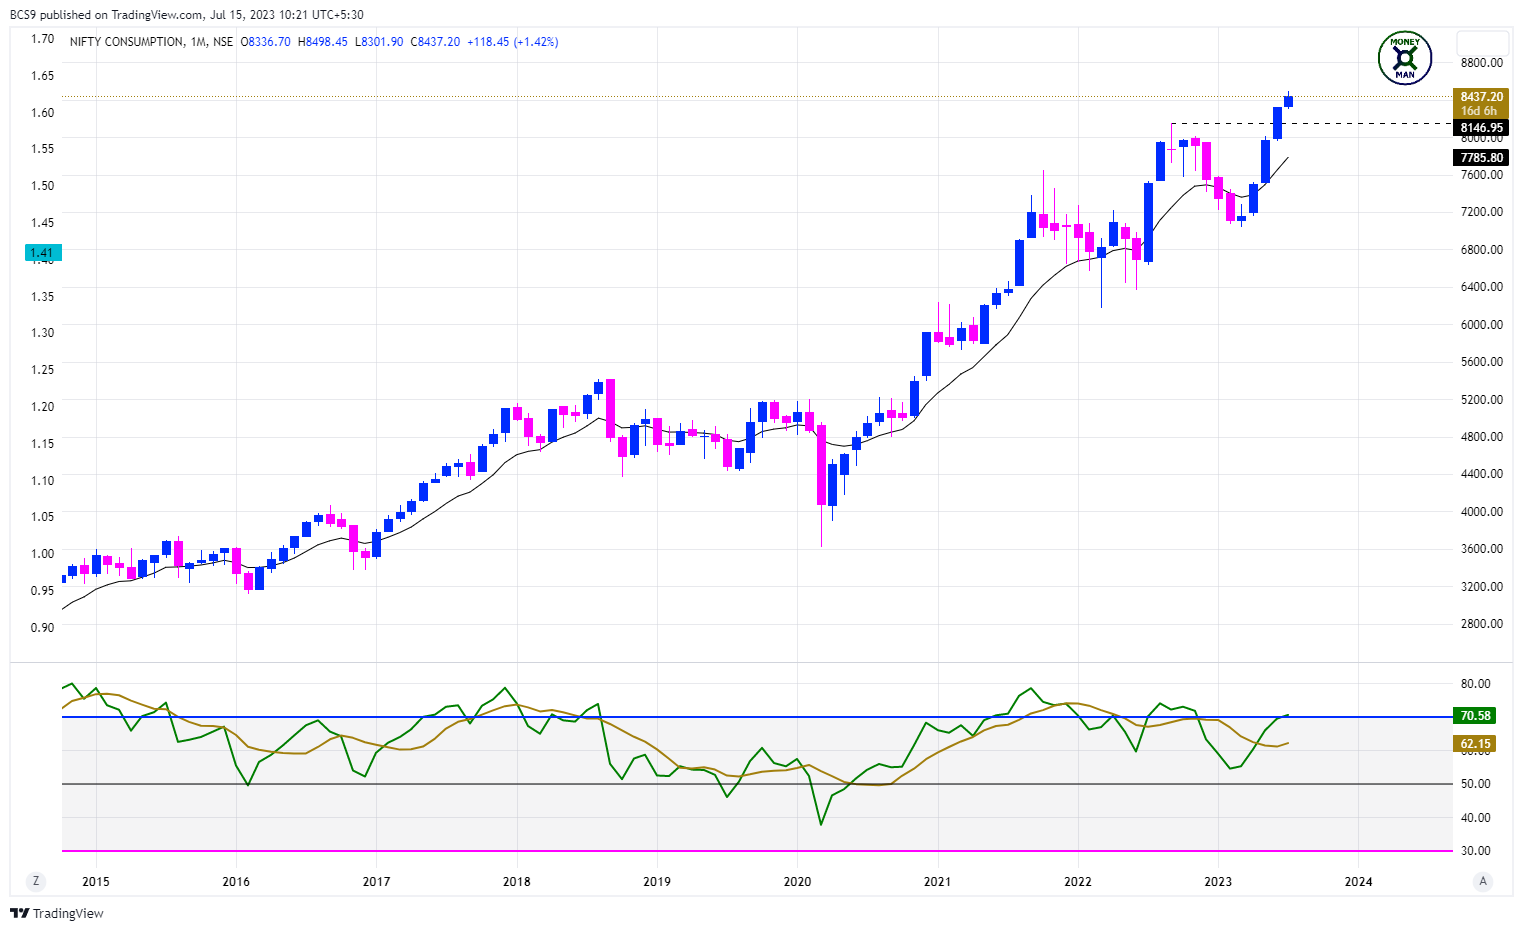
MONEYMAN TREND GUIDE:
Breakout above Consolidation Base: YES
Good Buying Momentum: YES
Stage 2 Advancing Phase: YES
At / Near ATH: YES
At / Near 52 Week Highs: YES
Price Action Structure: HH-HL
OBSERVATIONS:
Uptrend. Weekly & Monthly RSI over-bought. Weekly RSI seems to be giving a bearish divergence.
FINAL RANKING: B
10. NIFTY CPSE
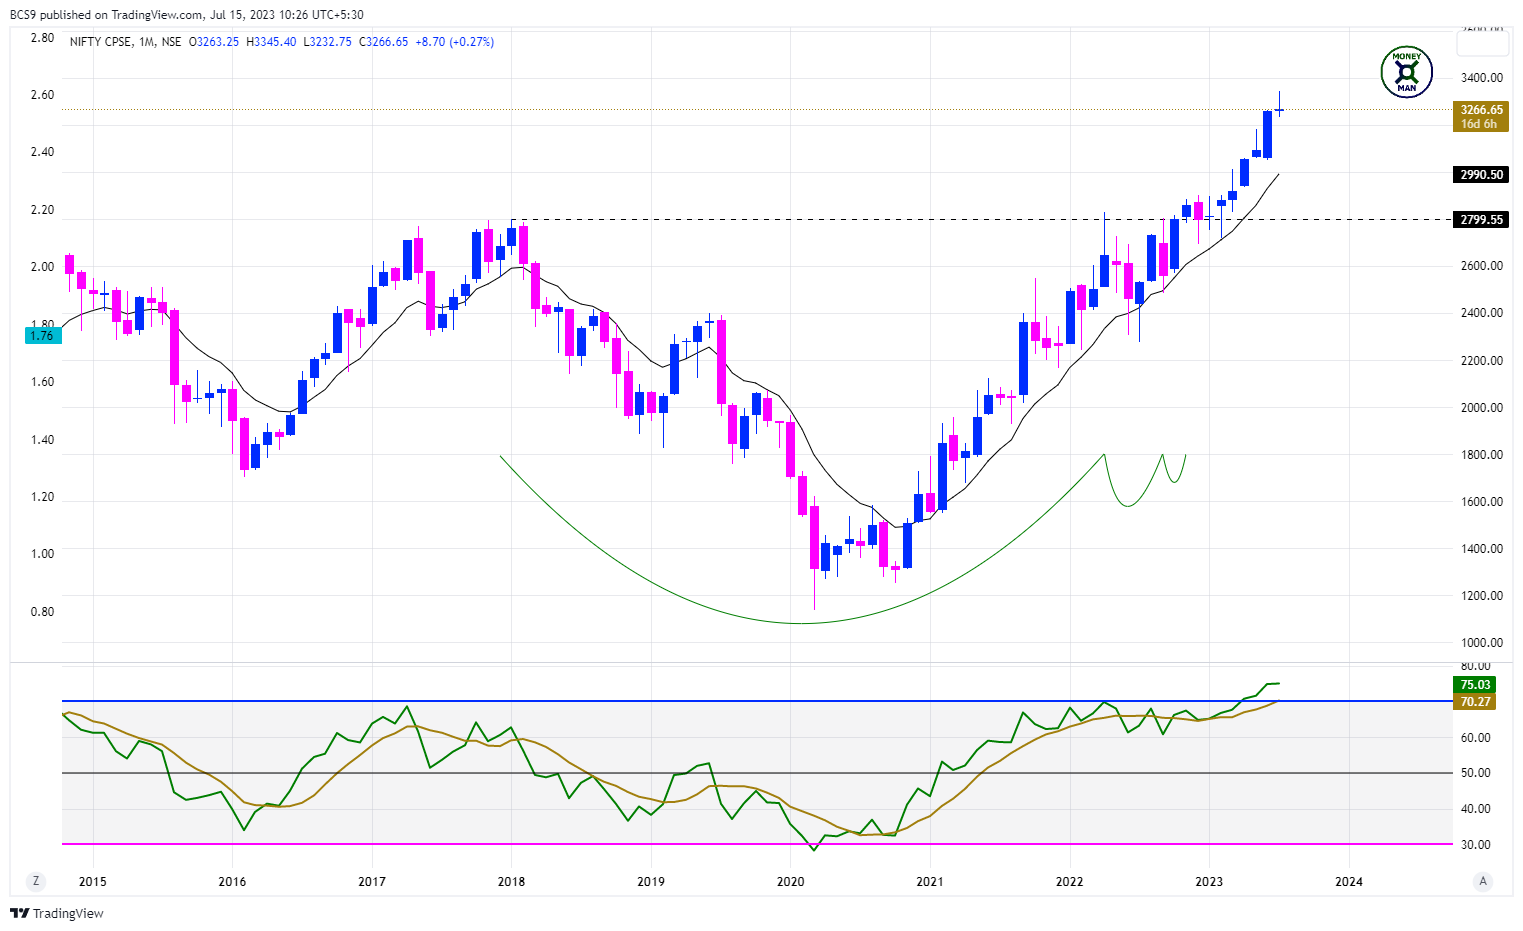
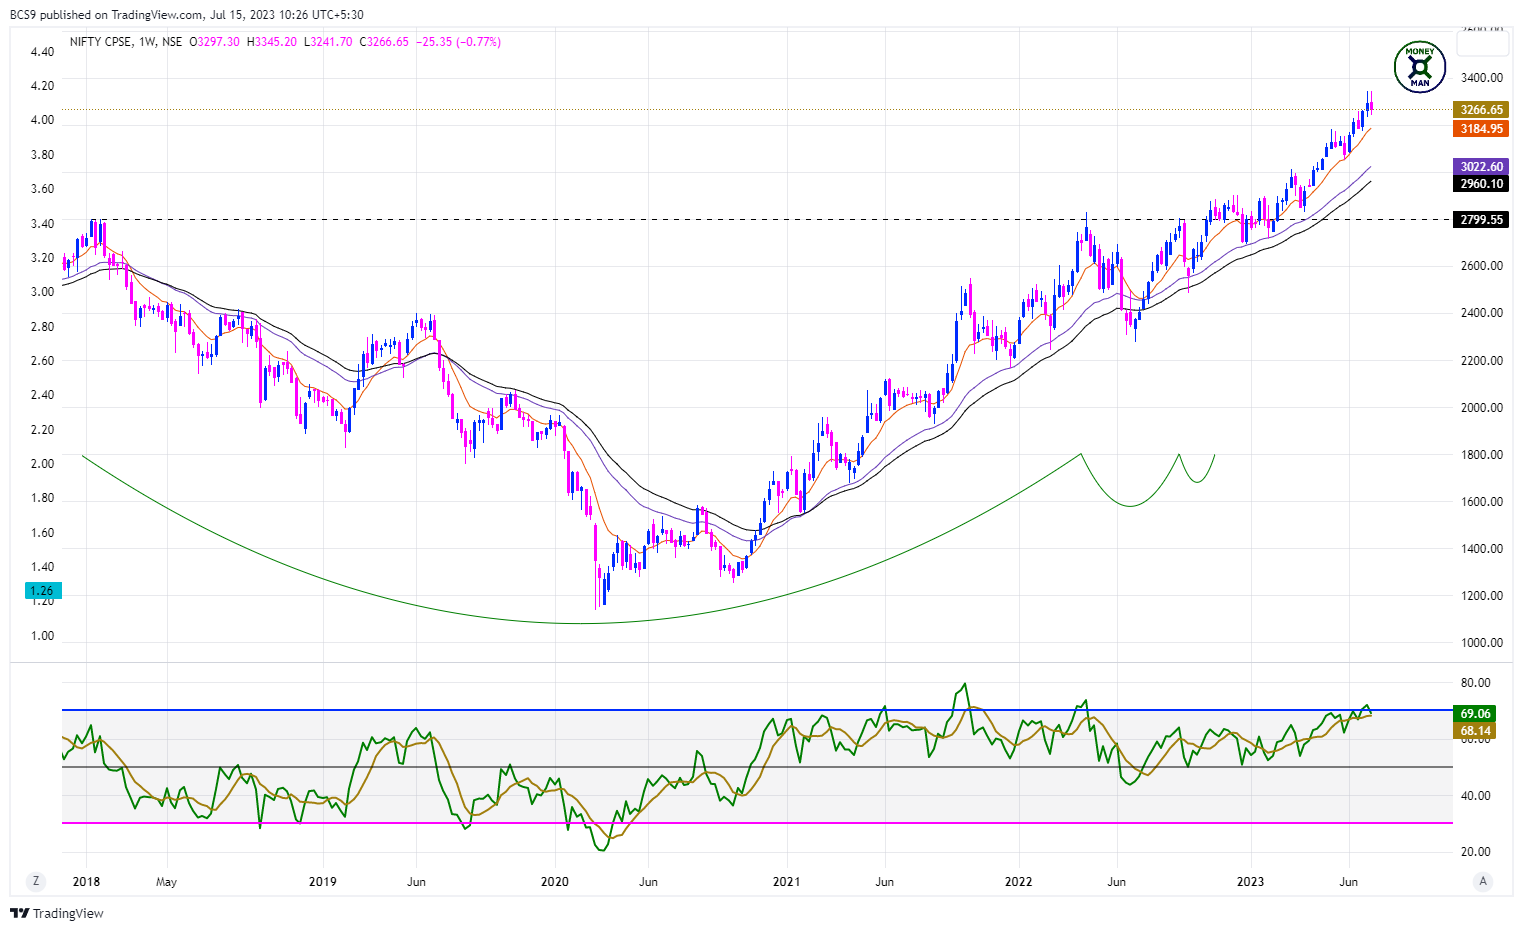
MONEYMAN TREND GUIDE:
Breakout above Consolidation Base: YES
Good Buying Momentum: YES
Stage 2 Advancing Phase: YES
At / Near ATH: YES
At / Near 52 Week Highs: YES
Price Action Structure: HH-HL
OBSERVATIONS:
Uptrend. Near ATH. Monthly RSI over-bought.
FINAL RANKING: A
11. NIFTY ENERGY
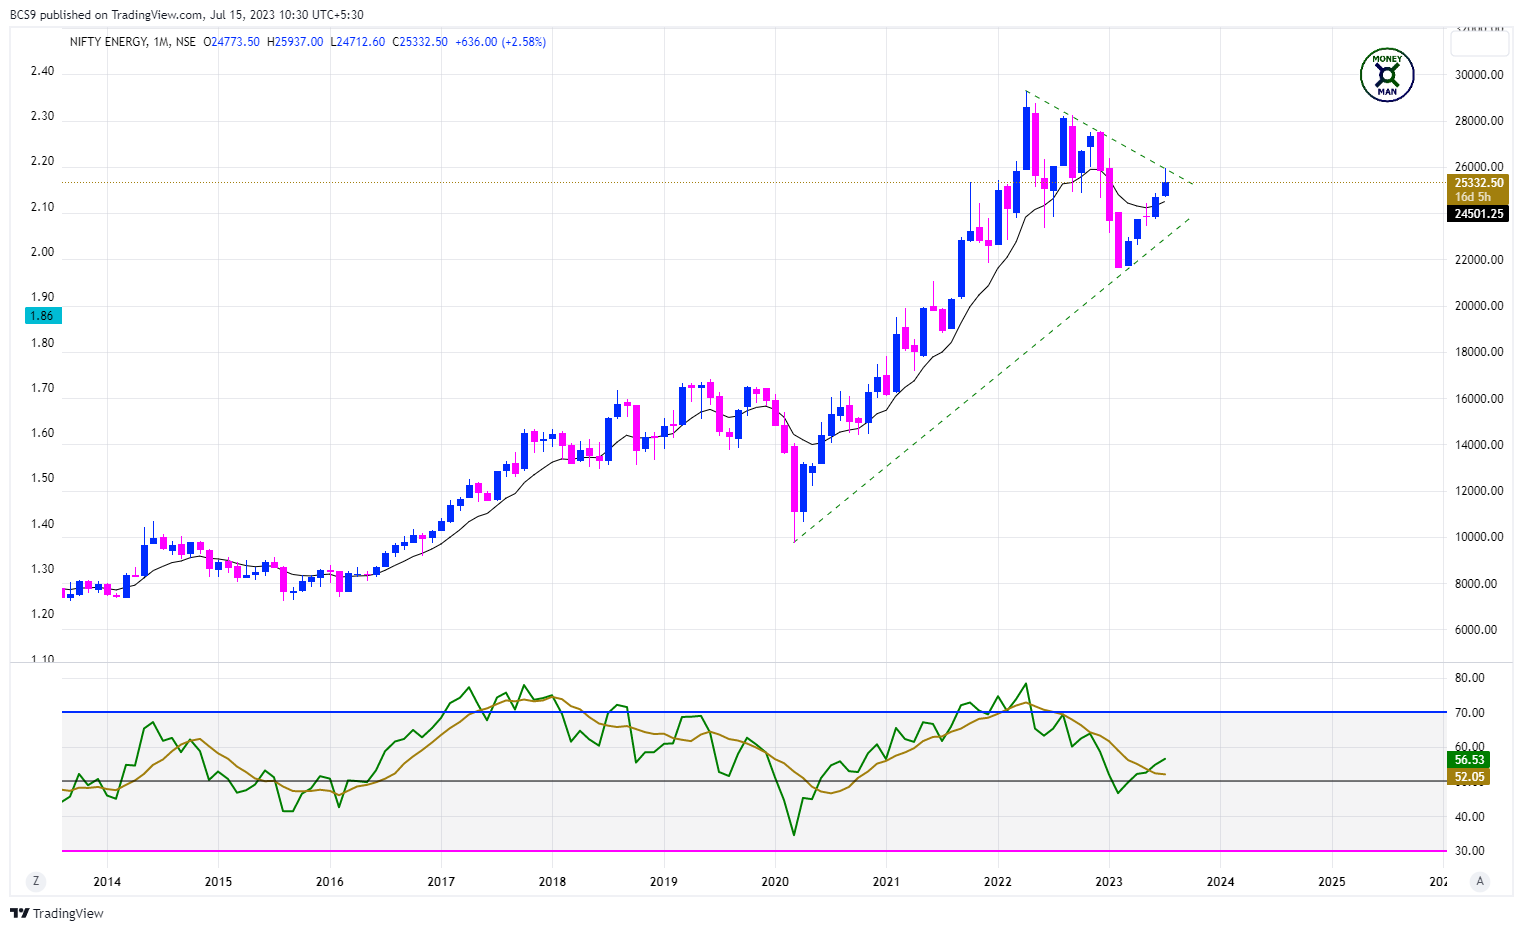
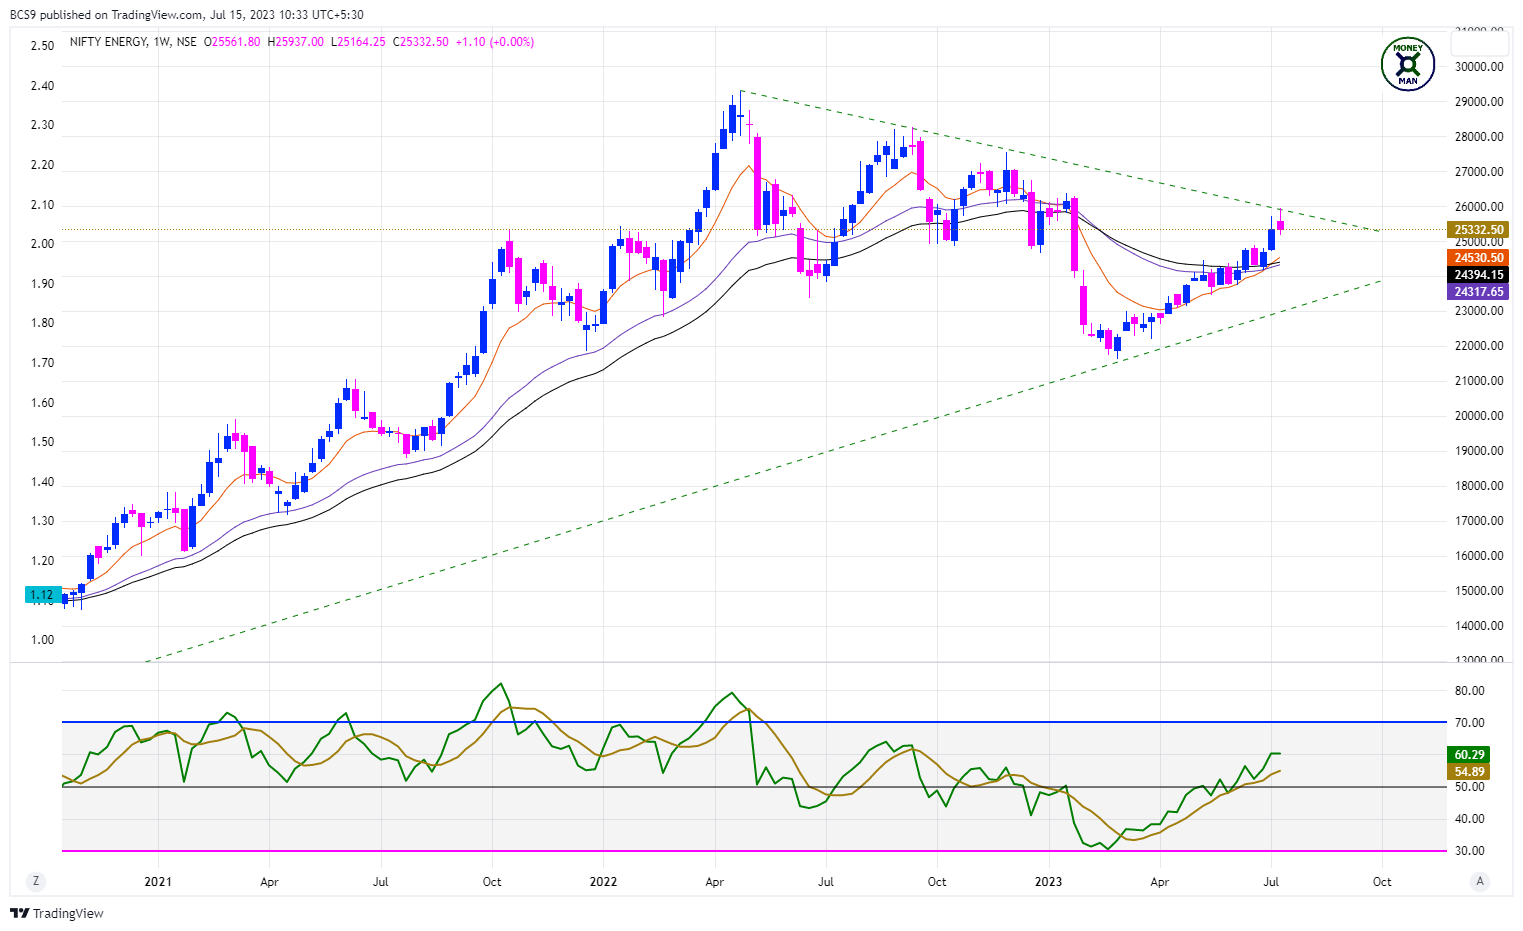
MONEYMAN TREND GUIDE:
Breakout above Consolidation Base: NO
Good Buying Momentum: YES
Stage 2 Advancing Phase: NO
At / Near ATH: NO
At / Near 52 Week Highs: NO
Price Action Structure: HH-HL
OBSERVATIONS:
Consolidation stage.
FINAL RANKING: C
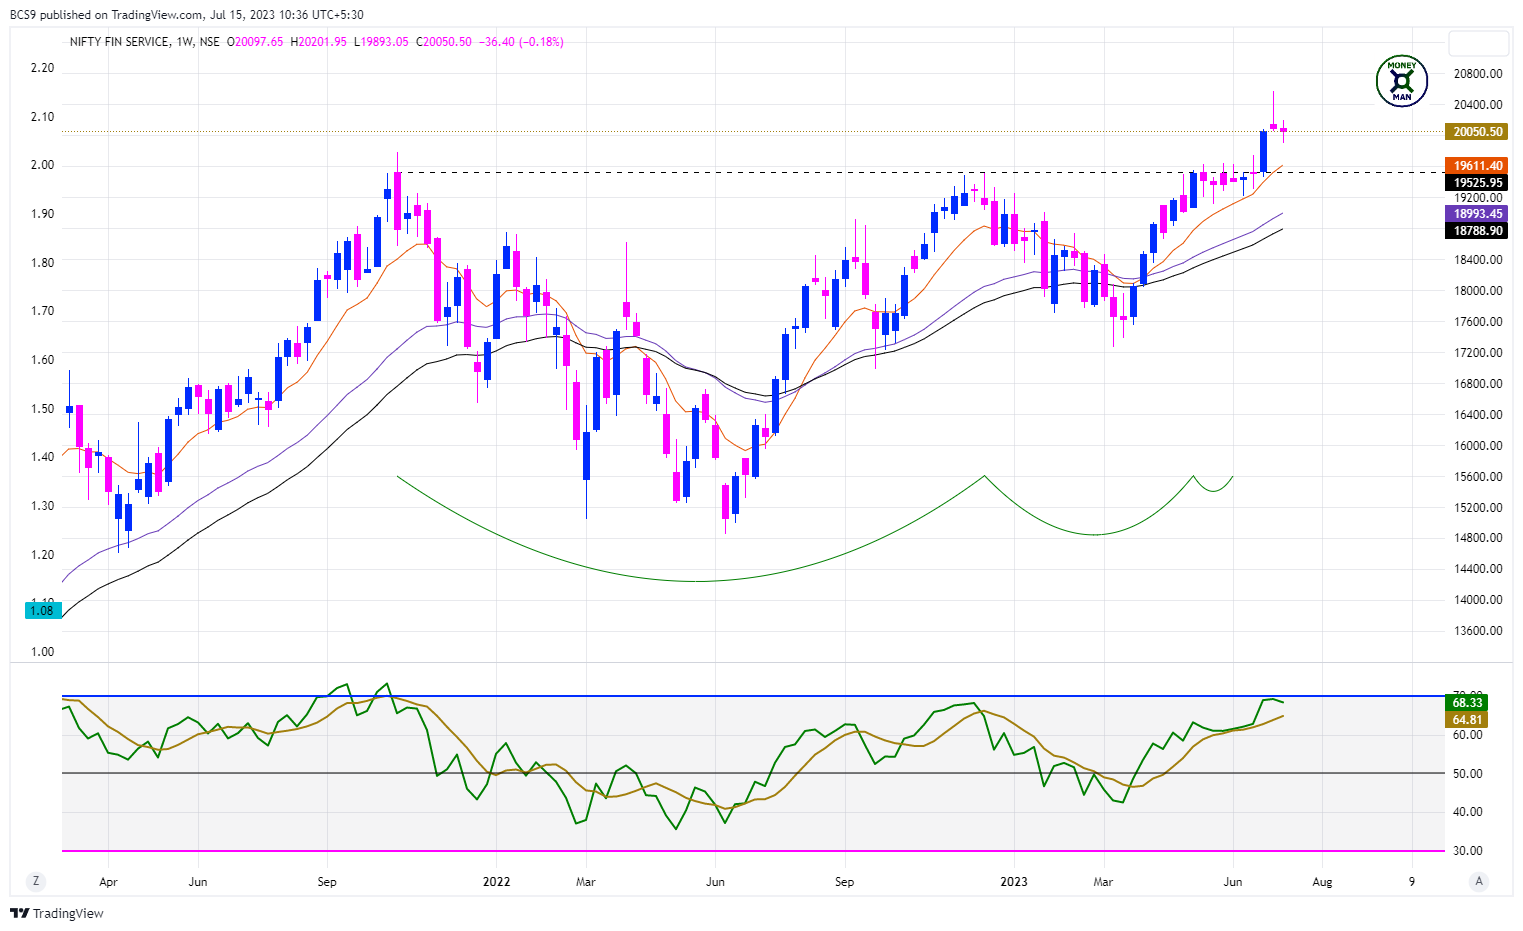
12. NIFTY FINANCIAL SERVICES
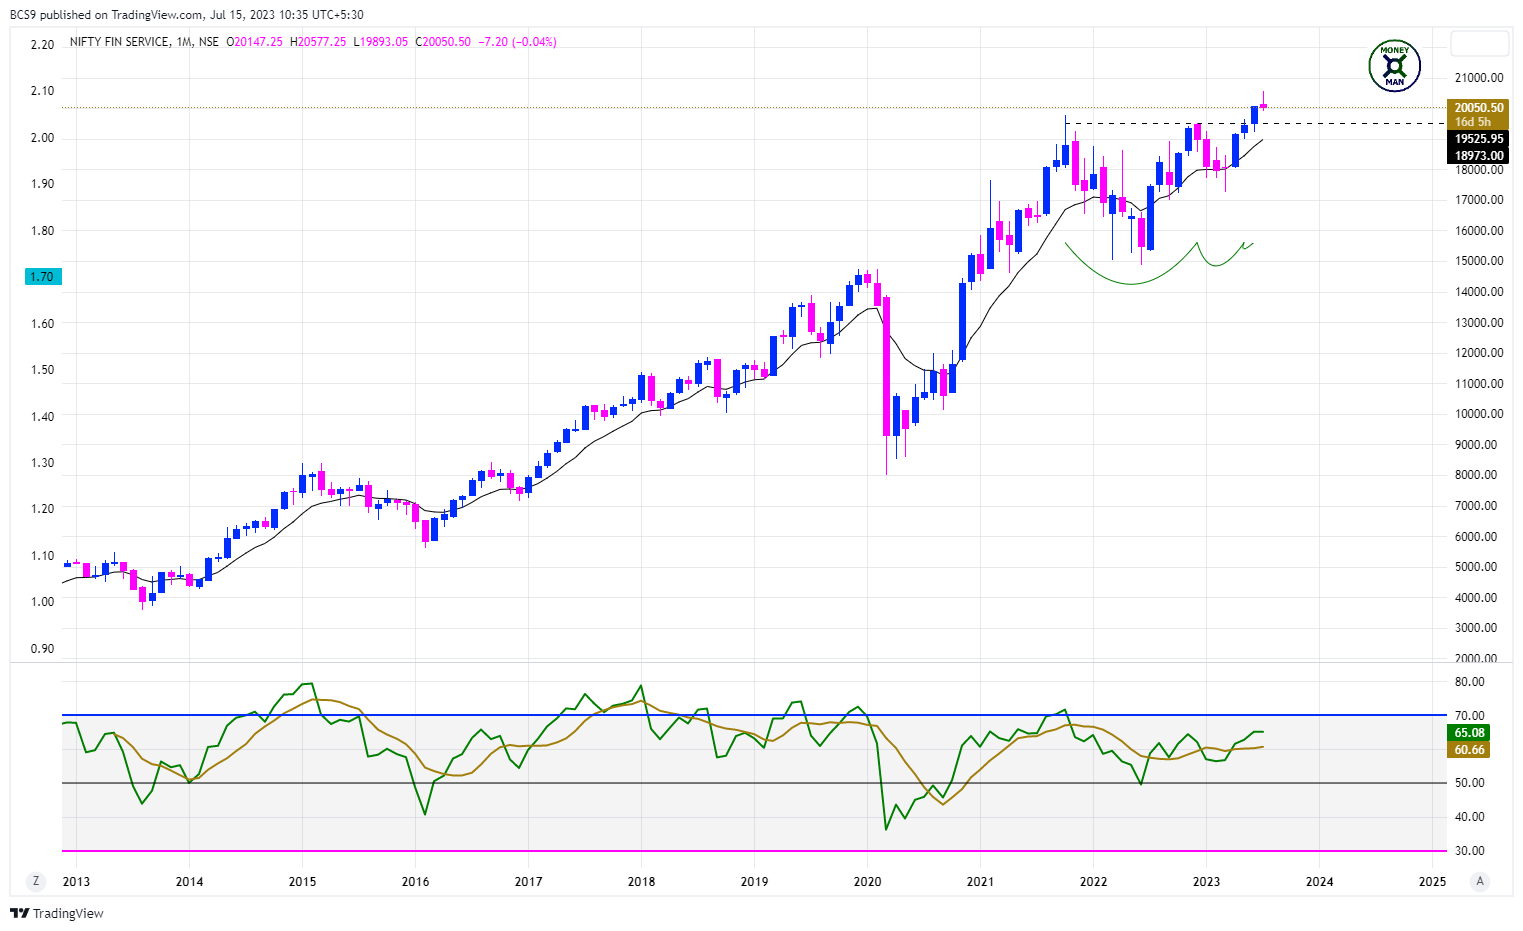
MONEYMAN TREND GUIDE:
Breakout above Consolidation Base: YES
Good Buying Momentum: YES
Stage 2 Advancing Phase: YES
At / Near ATH: YES
At / Near 52 Week Highs: YES
Price Action Structure: HH-HL
OBSERVATIONS:
Consolidating after breaking out and getting extended.
FINAL RANKING: A
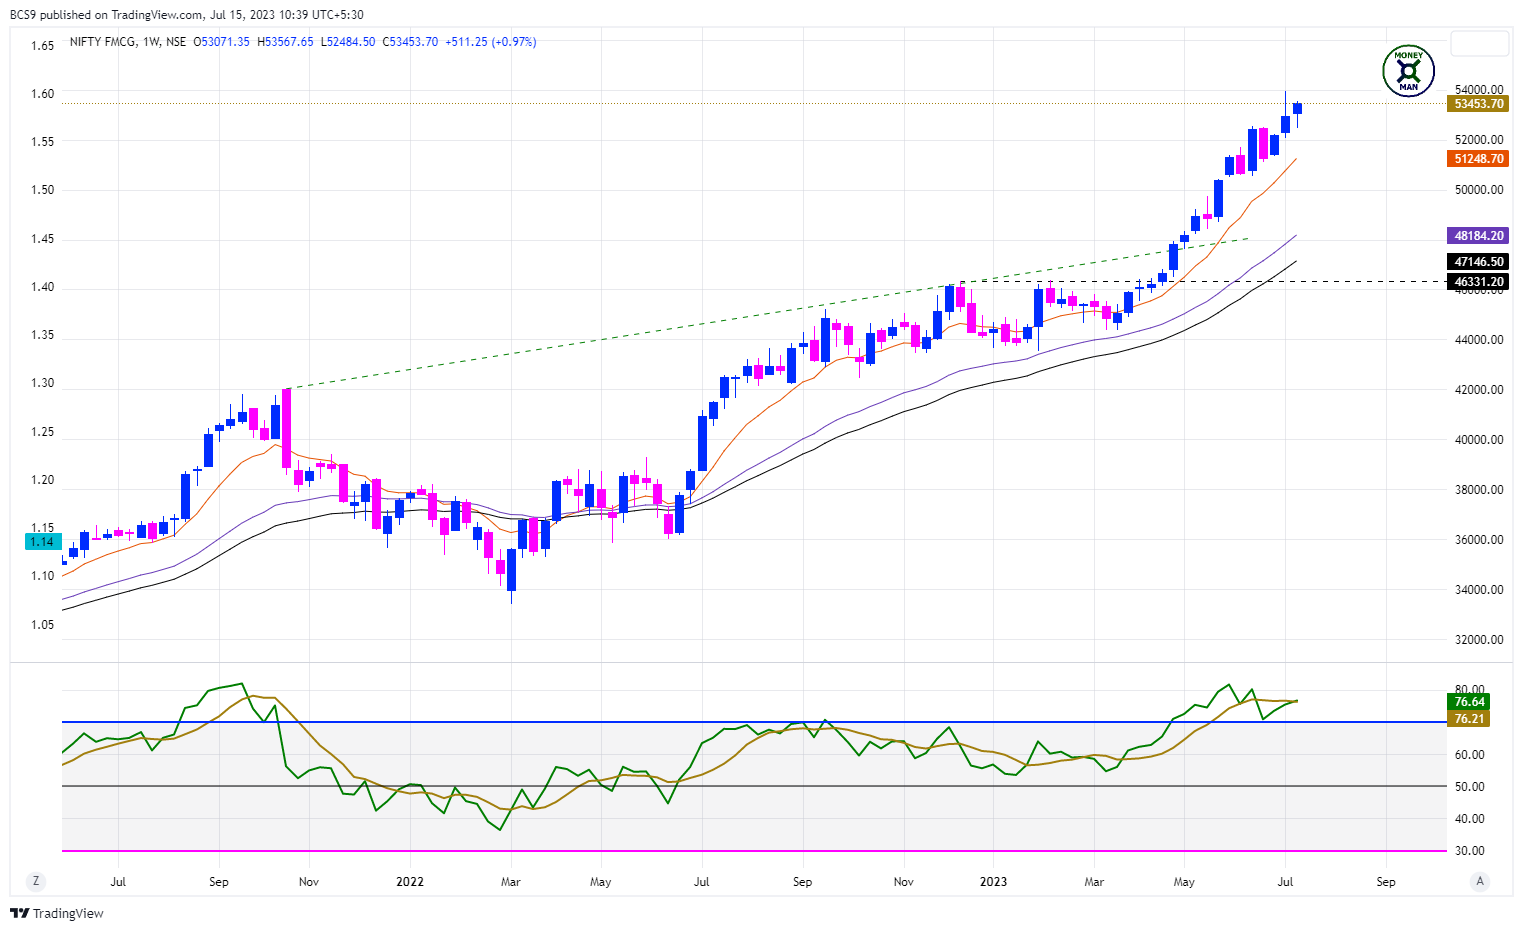
13. NIFTY FMCG
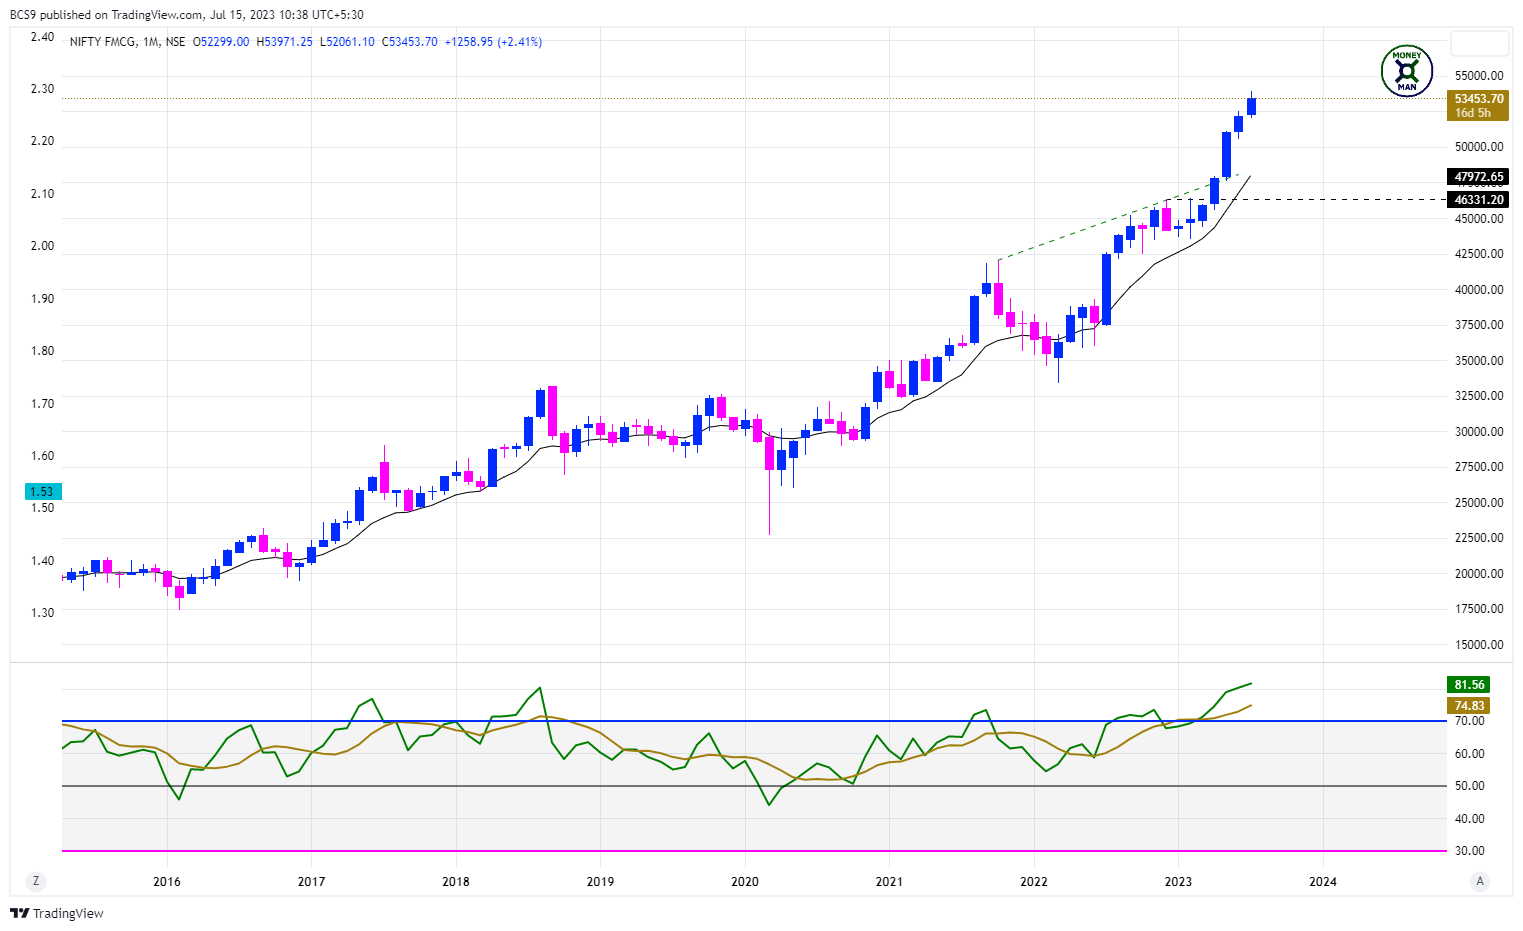
MONEYMAN TREND GUIDE:
Breakout above Consolidation Base: YES
Good Buying Momentum: YES
Stage 2 Advancing Phase: YES
At / Near ATH: YES
At / Near 52 Week Highs: YES
Price Action Structure: HH-HL
OBSERVATIONS:
Had broken over an upward sloping trendline. Weekly & Monthly RSI over-bought. Weekly RSI seems to be forming a bearish divergence. Maybe time to conserve profits.
FINAL RANKING: C
14. NIFTY HEALTHCARE
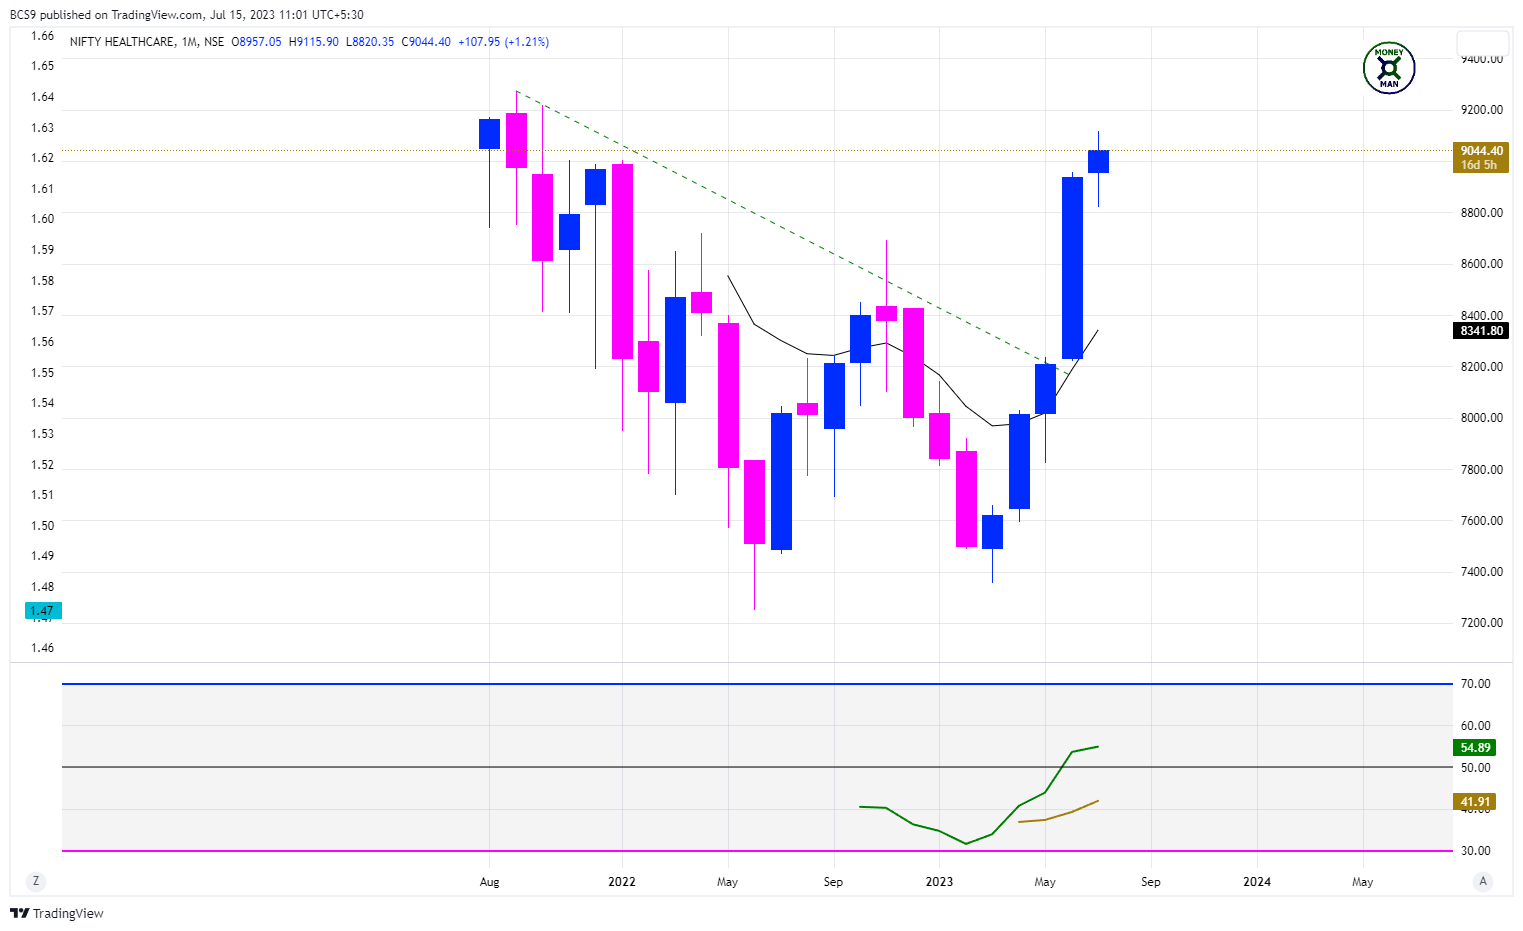
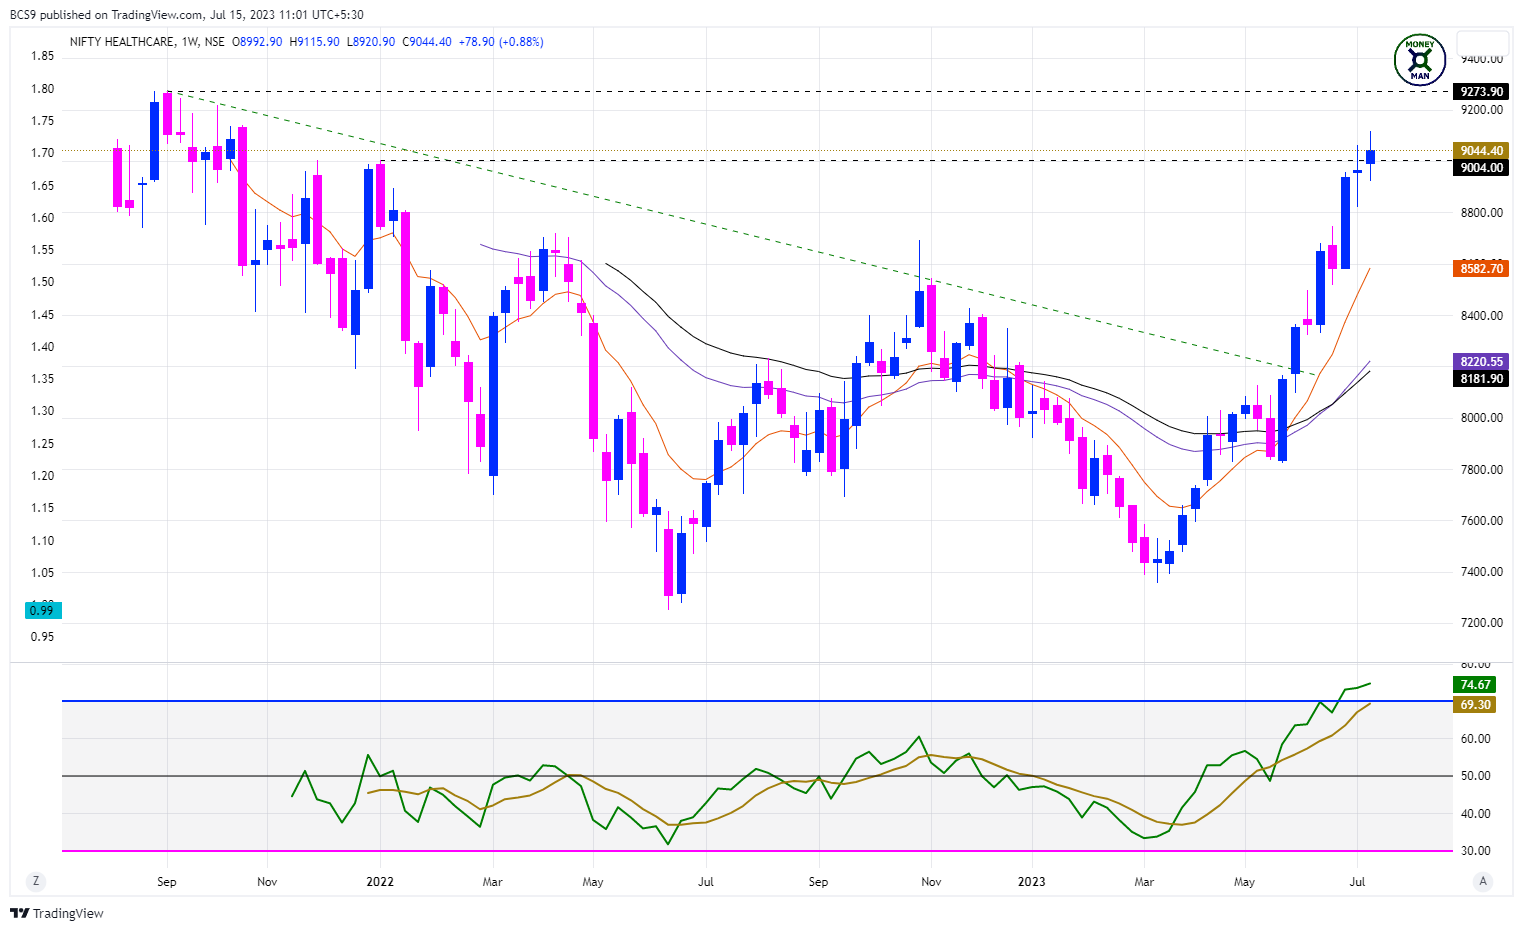
MONEYMAN TREND GUIDE:
Breakout above Consolidation Base: YES
Good Buying Momentum: YES
Stage 2 Advancing Phase: YES
At / Near ATH: NO
At / Near 52 Week Highs: YES
Price Action Structure: HH-HL
OBSERVATIONS:
Very strong buying momentum. Weekly RSI over-bought. Move getting extended.
FINAL RANKING: B
15. NIFTY INFRA
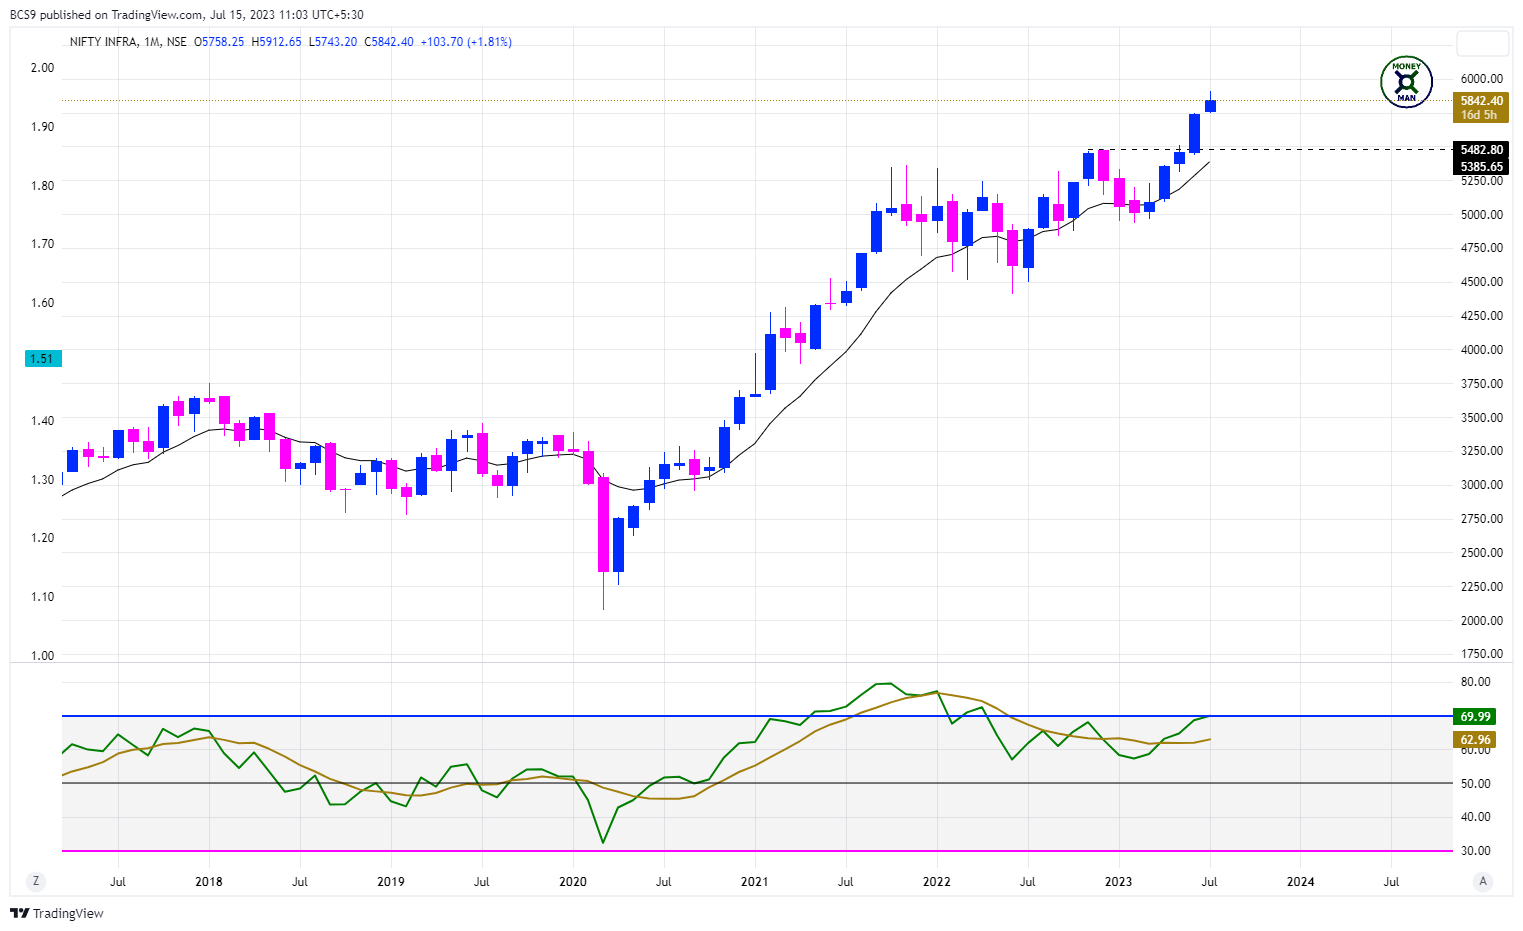
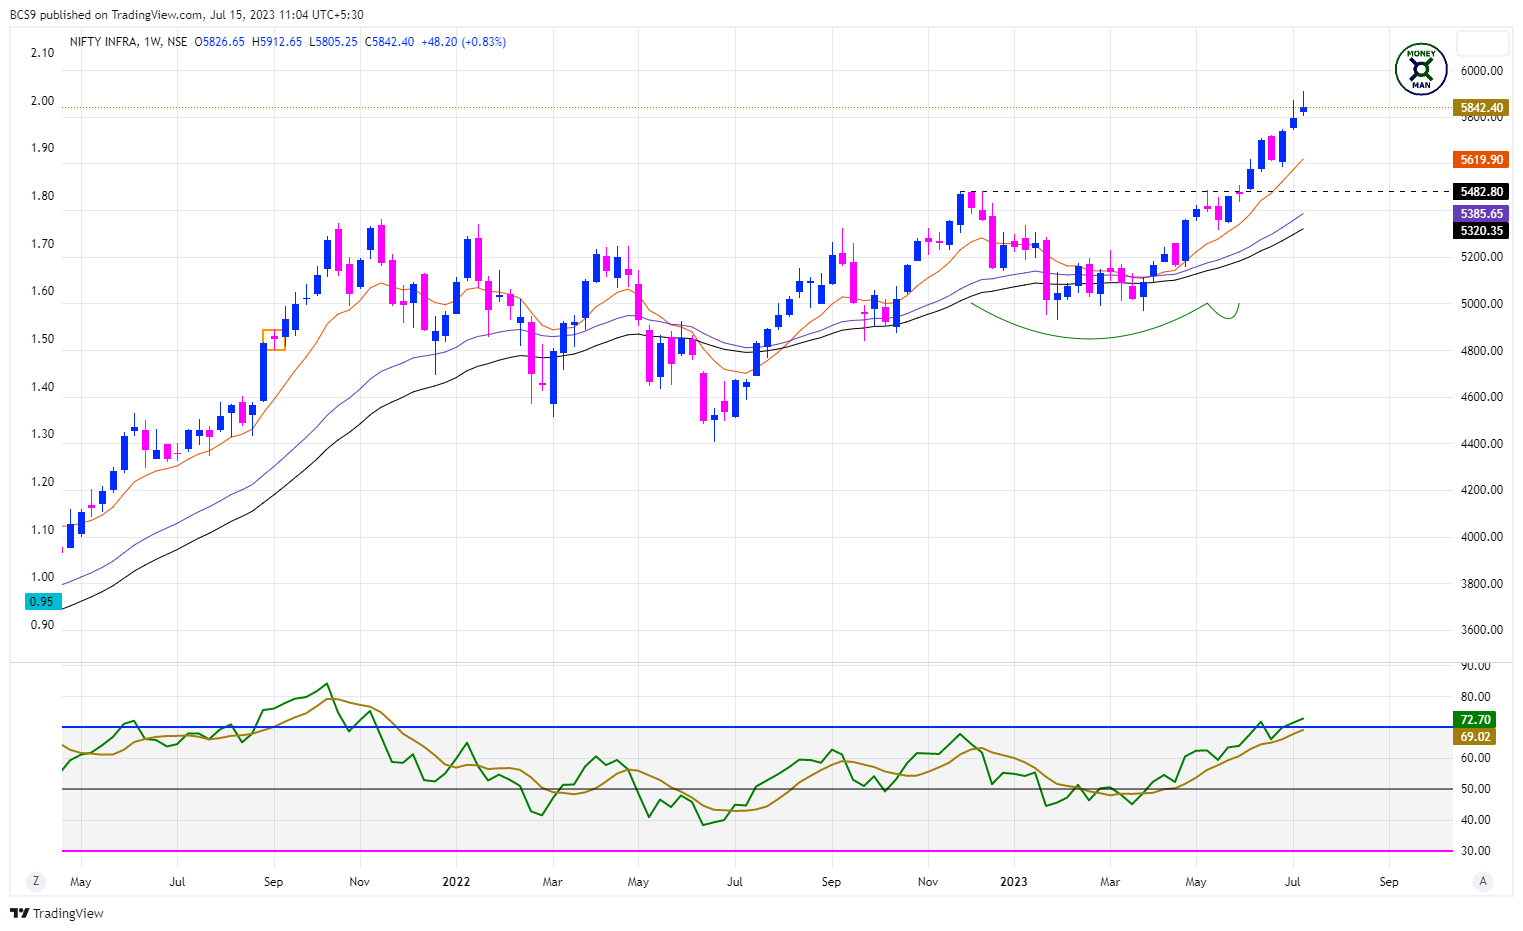
MONEYMAN TREND GUIDE:
Breakout above Consolidation Base: YES
Good Buying Momentum: YES
Stage 2 Advancing Phase: YES
At / Near ATH: YES
At / Near 52 Week Highs: YES
Price Action Structure: HH-HL
OBSERVATIONS:
Strong buying momentum. Getting slightly extended. Weekly & Monthly RSI over-bought.
FINAL RANKING: B
16. NIFTY IT

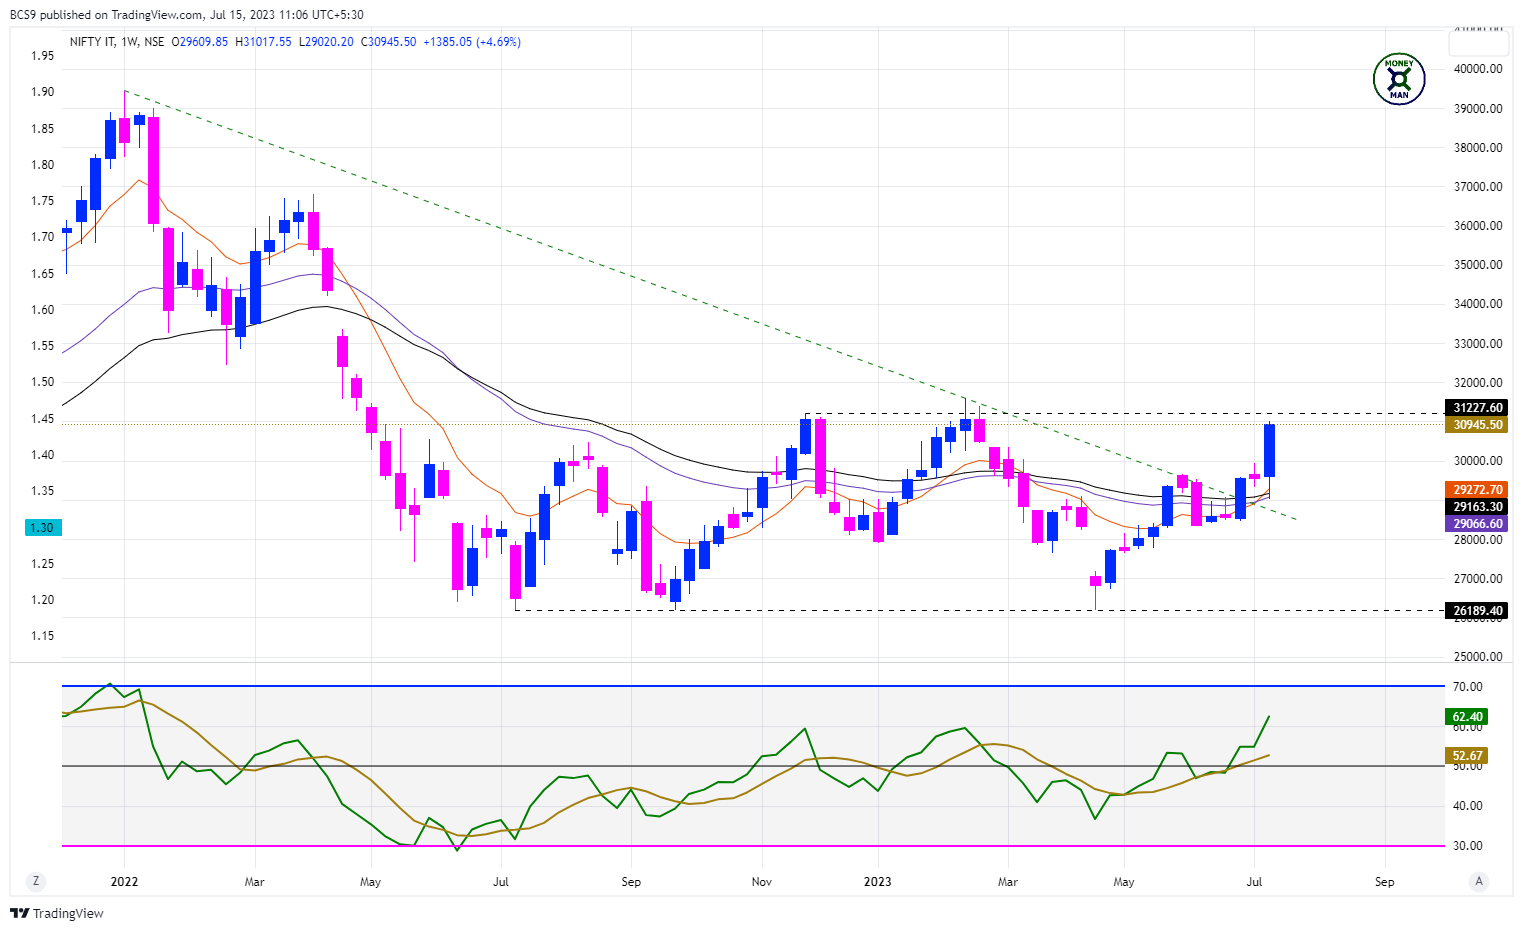
MONEYMAN TREND GUIDE:
Breakout above Consolidation Base: NO
Good Buying Momentum: NO
Stage 2 Advancing Phase: NO
At / Near ATH: NO
At / Near 52 Week Highs: YES
Price Action Structure: UNDER FORMATION
OBSERVATIONS:
Trying to recover from recent fall. Momentum is building up.
FINAL RANKING: B
17. NIFTY MEDIA
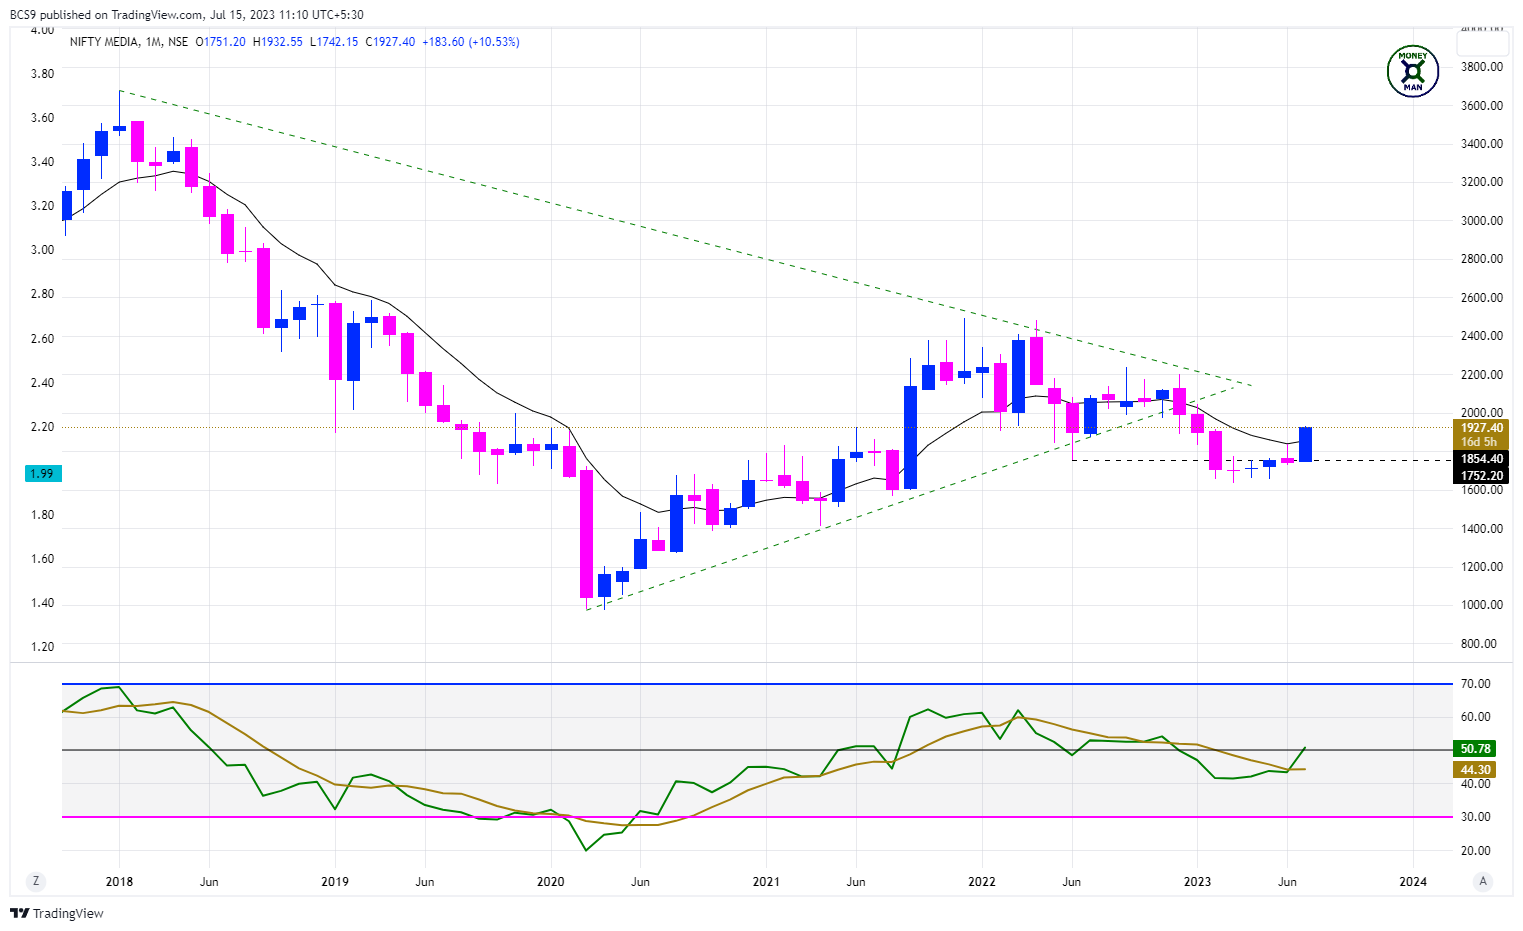
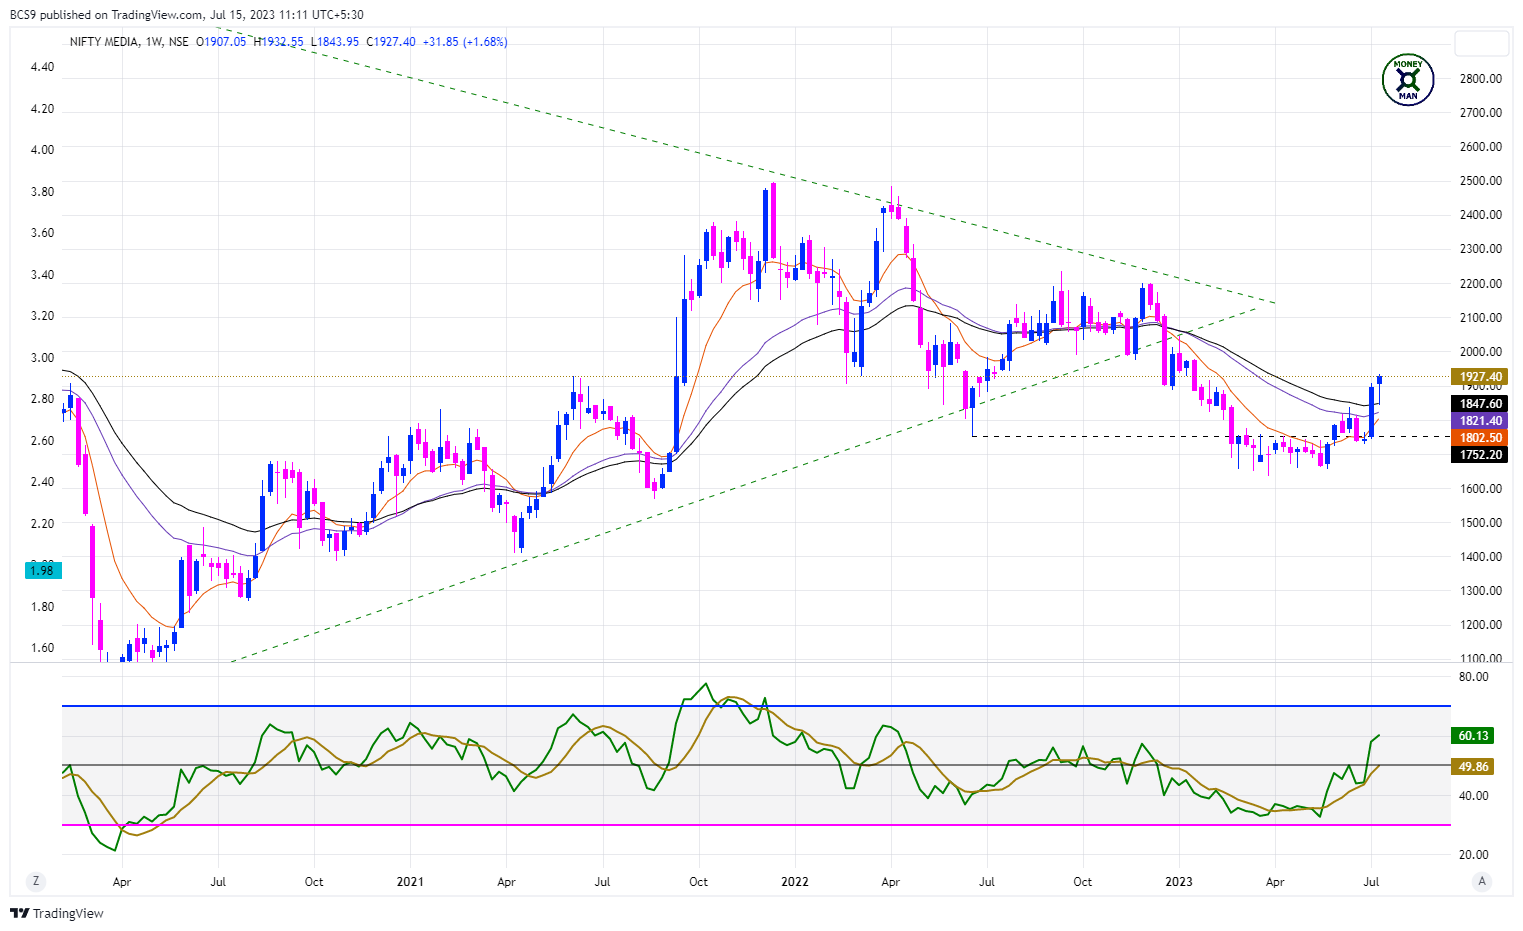
MONEYMAN TREND GUIDE:
Breakout above Consolidation Base: NO
Good Buying Momentum: YES
Stage 2 Advancing Phase: NO
At / Near ATH: NO
At / Near 52 Week Highs: NO
Price Action Structure: UNDER FORMATION
OBSERVATIONS:
Looks like mostly bottomed out. Trying to change structure.
FINAL RANKING: C
18. NIFTY METAL
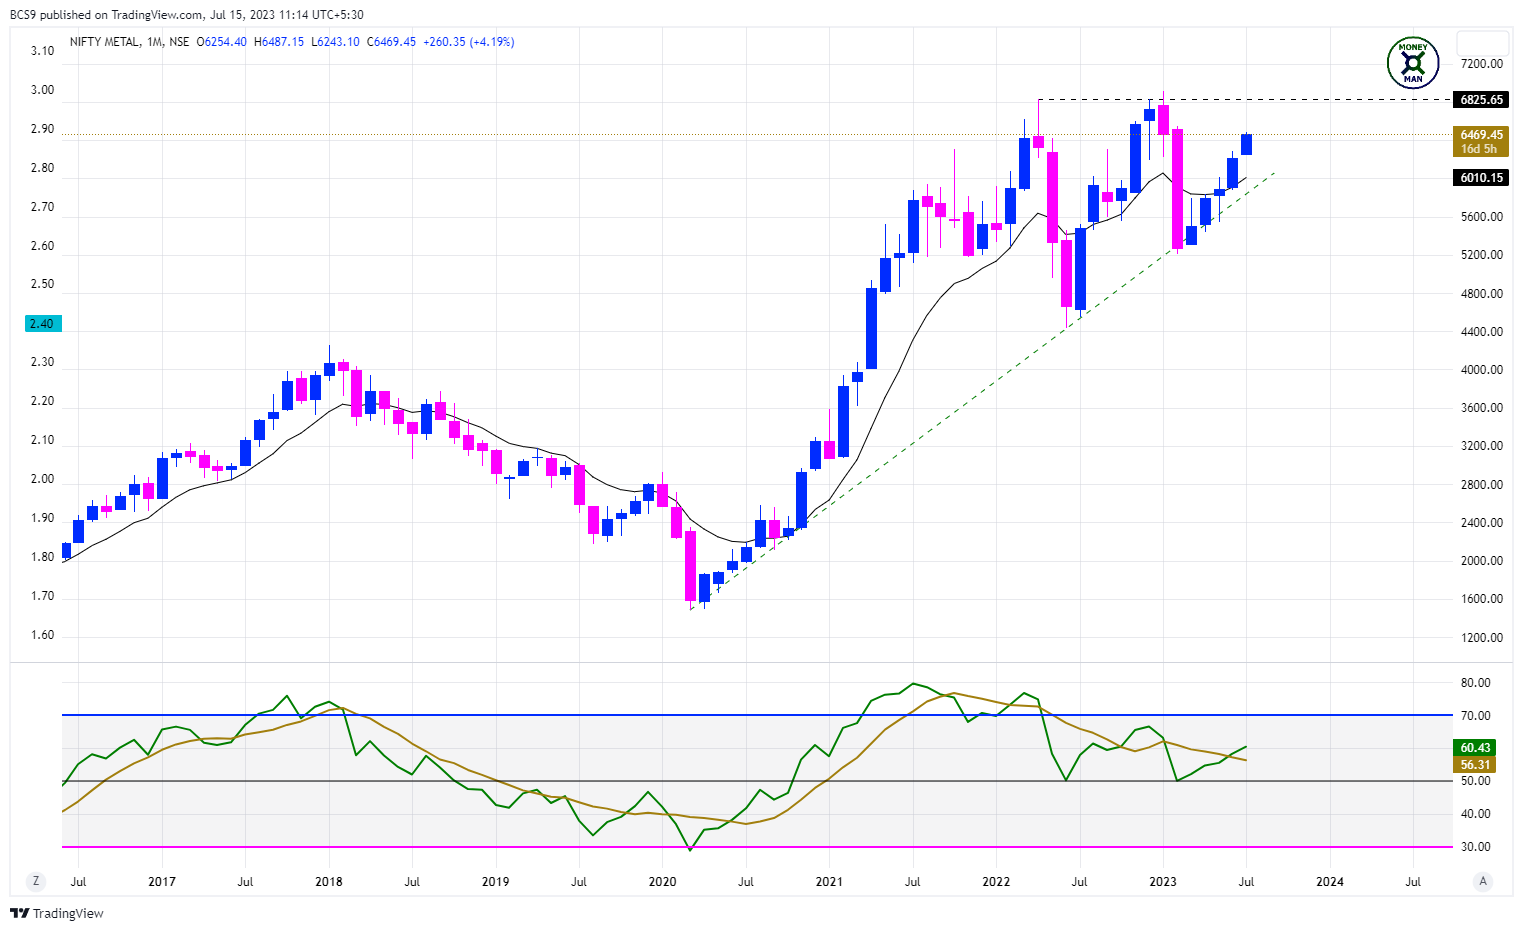
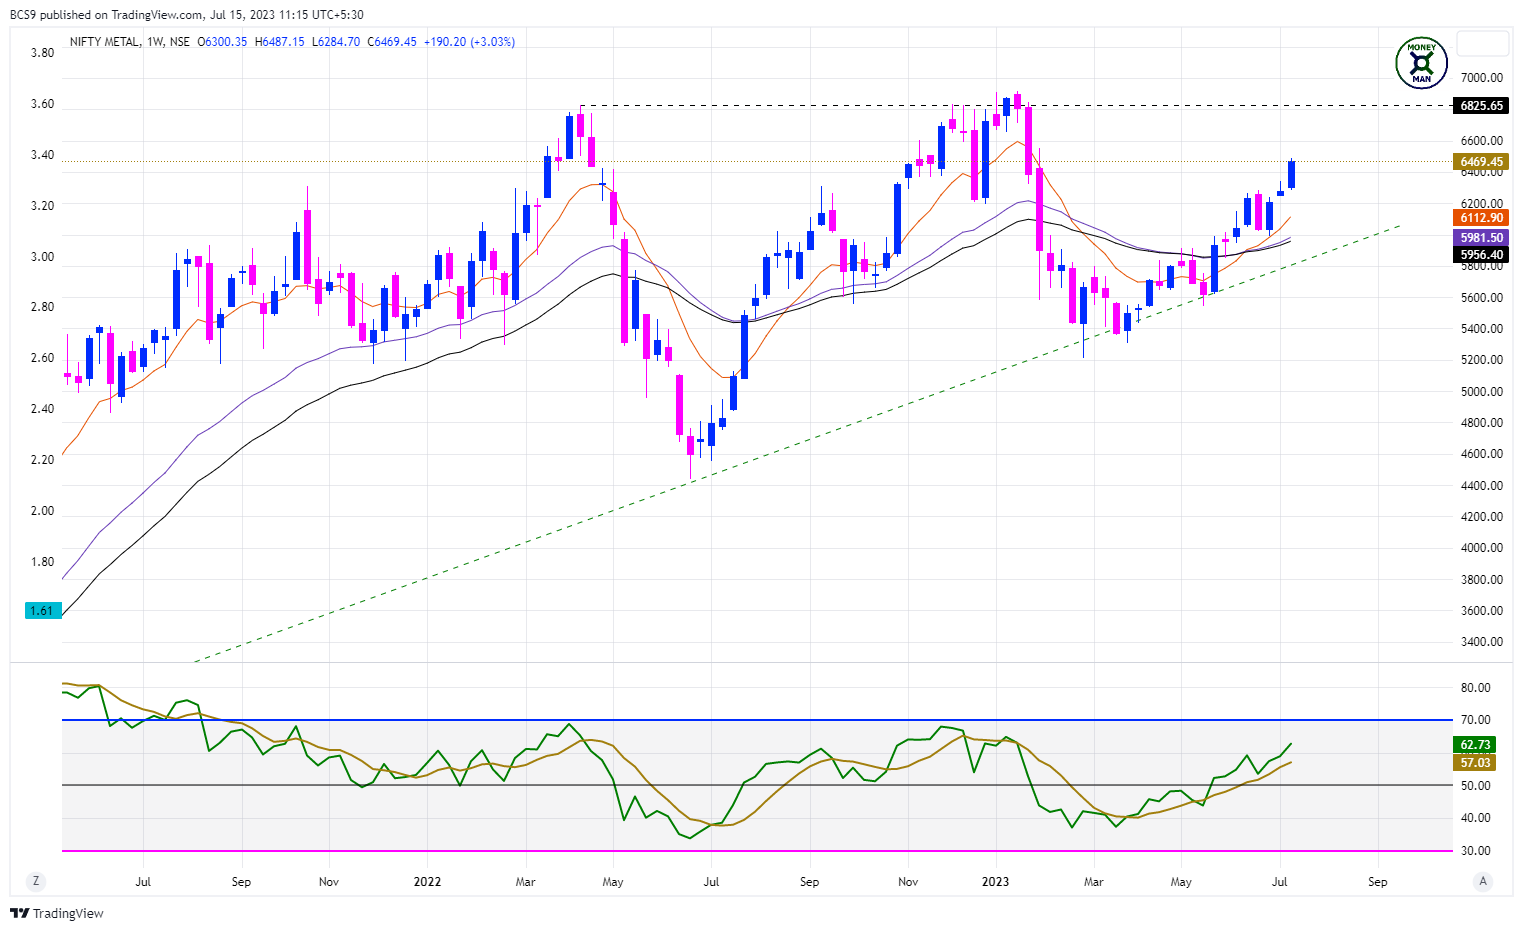
MONEYMAN TREND GUIDE:
Breakout above Consolidation Base: NO
Good Buying Momentum: YES
Stage 2 Advancing Phase: NO
At / Near ATH: NO
At / Near 52 Week Highs: NO
Price Action Structure: HH-HL
OBSERVATIONS:
Showing strong buying momentum. Price and Key MAs seem to be starting to stack up nicely.
FINAL RANKING: B
19. NIFTY OIL AND GAS
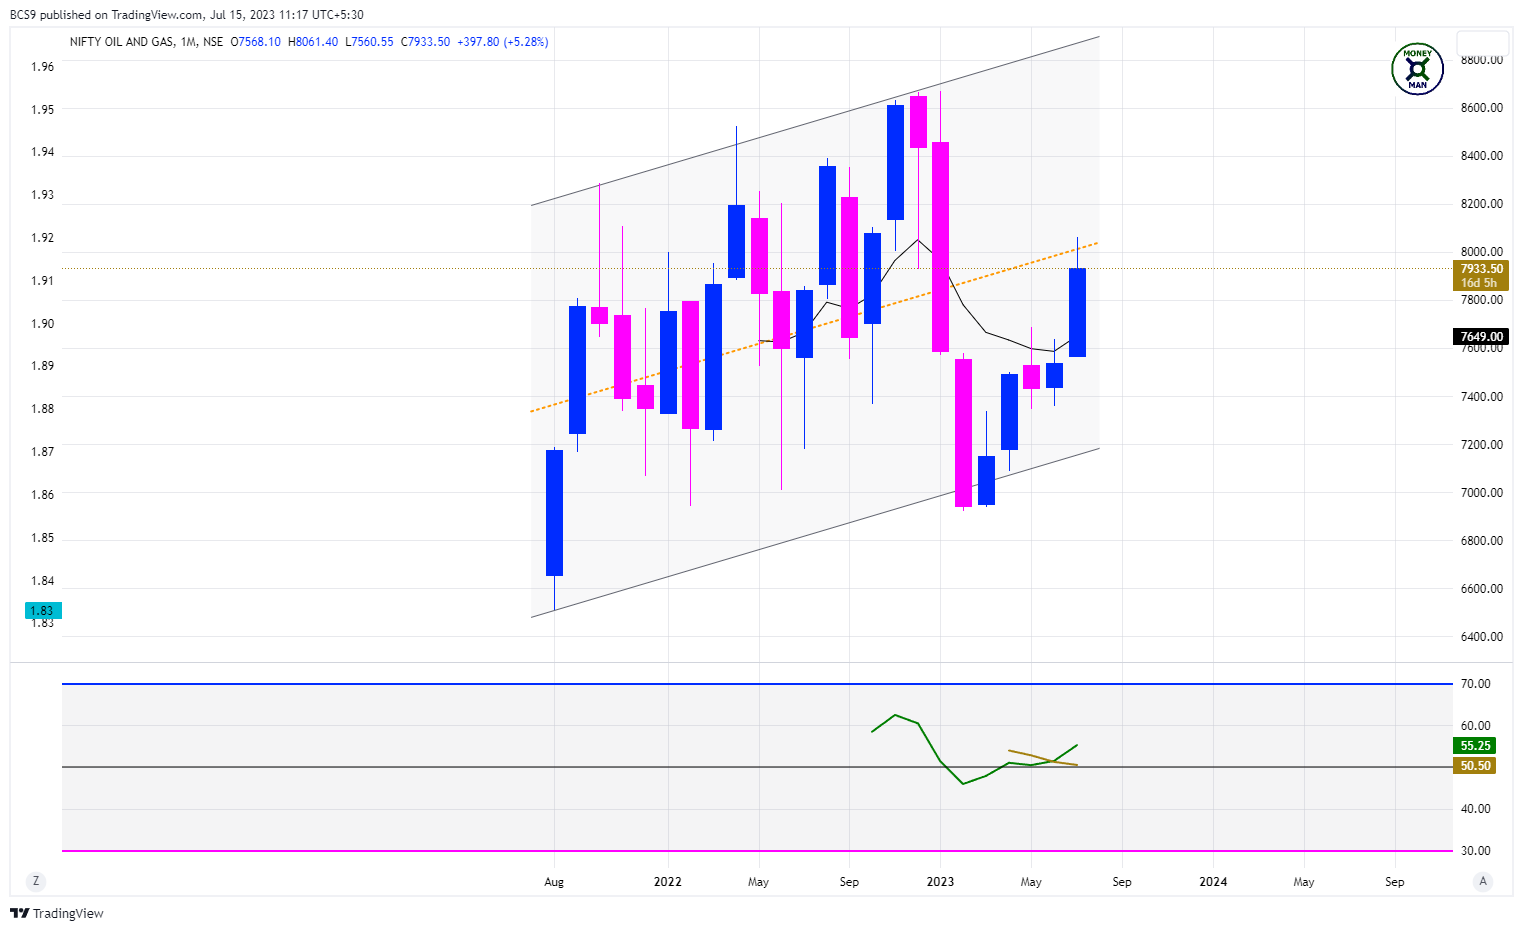
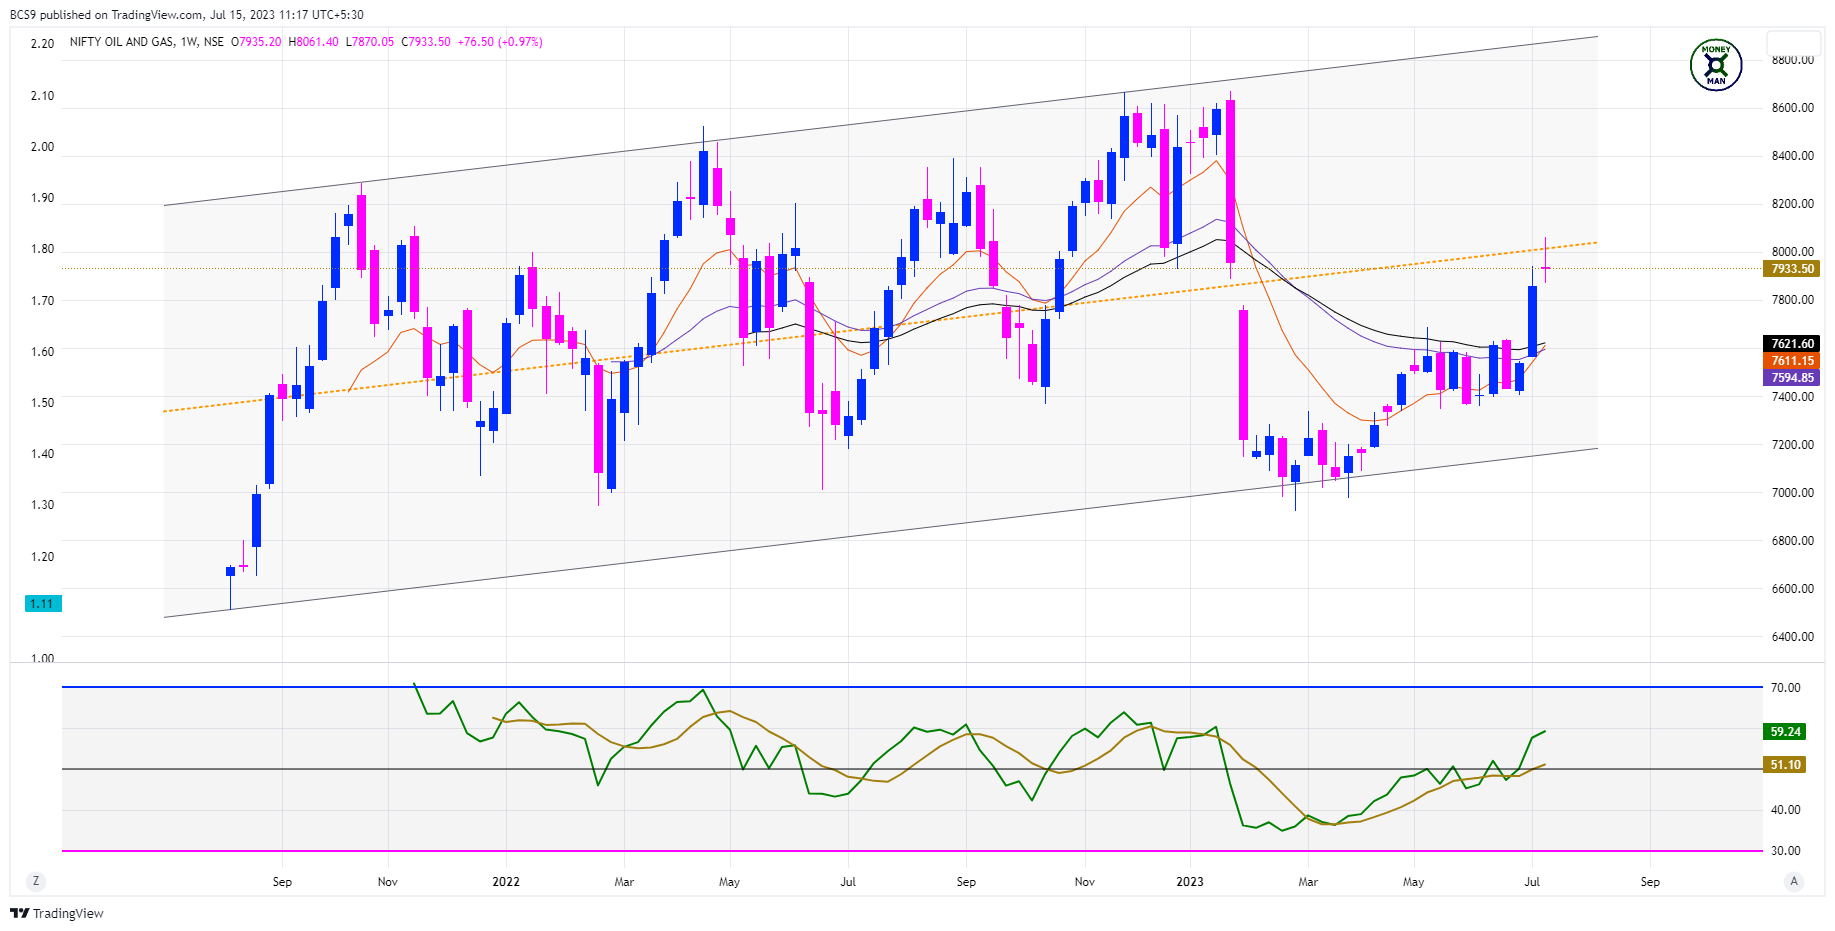
MONEYMAN TREND GUIDE:
Breakout above Consolidation Base: NO
Good Buying Momentum: NO
Stage 2 Advancing Phase: NO
At / Near ATH: NO
At / Near 52 Week Highs: NO
Price Action Structure: UNDER FORMATION
OBSERVATIONS:
Seems to be in a confused state.
FINAL RANKING: C
20. NIFTY PHARMA
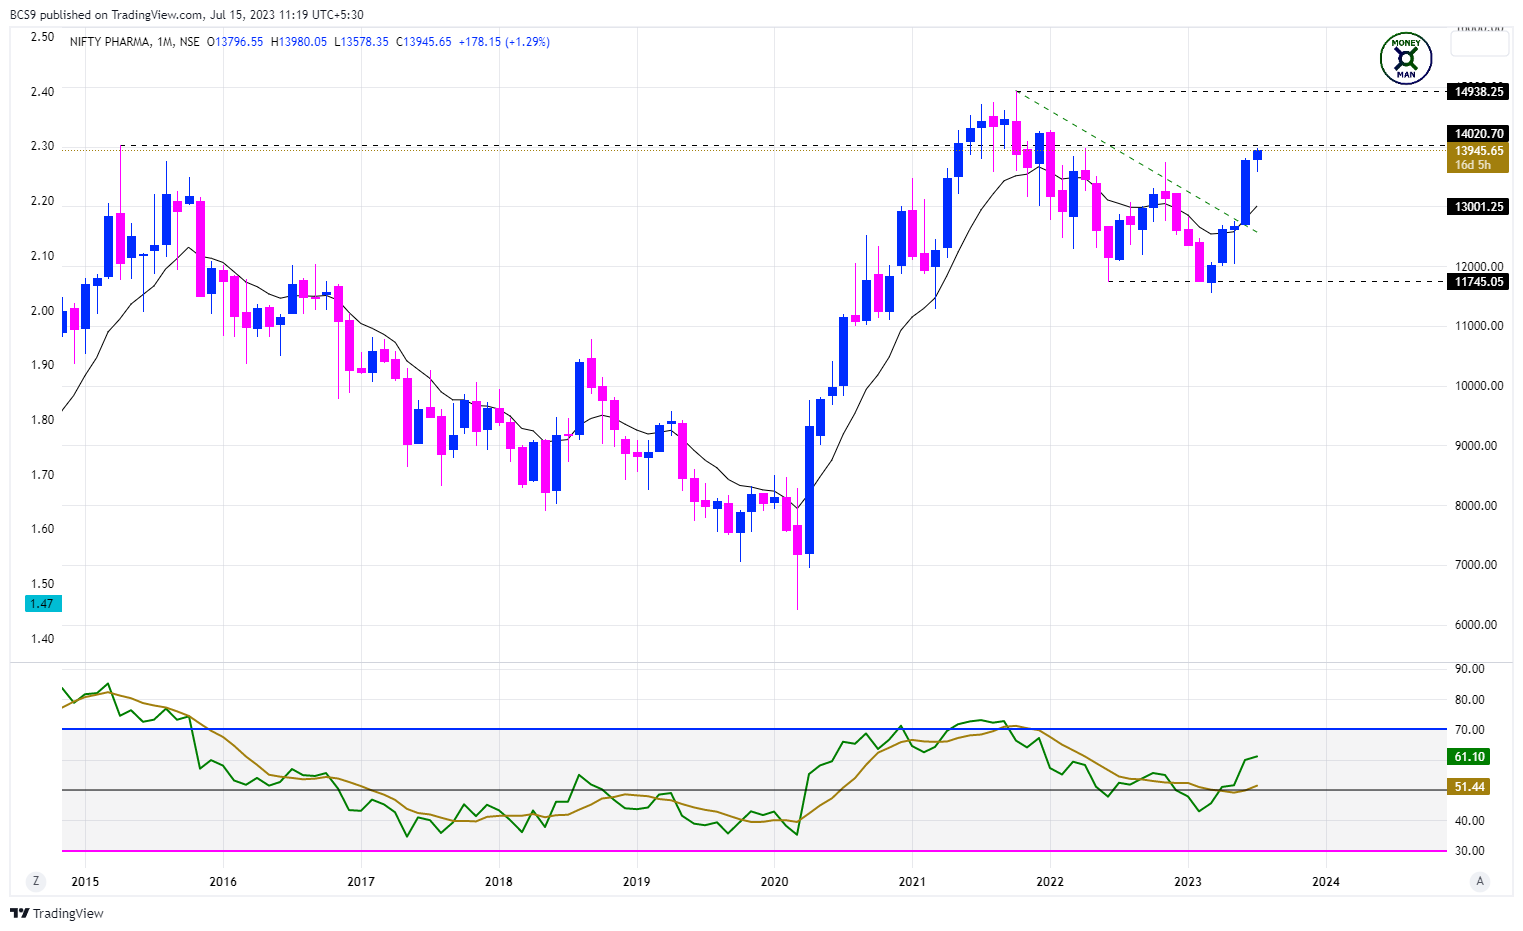
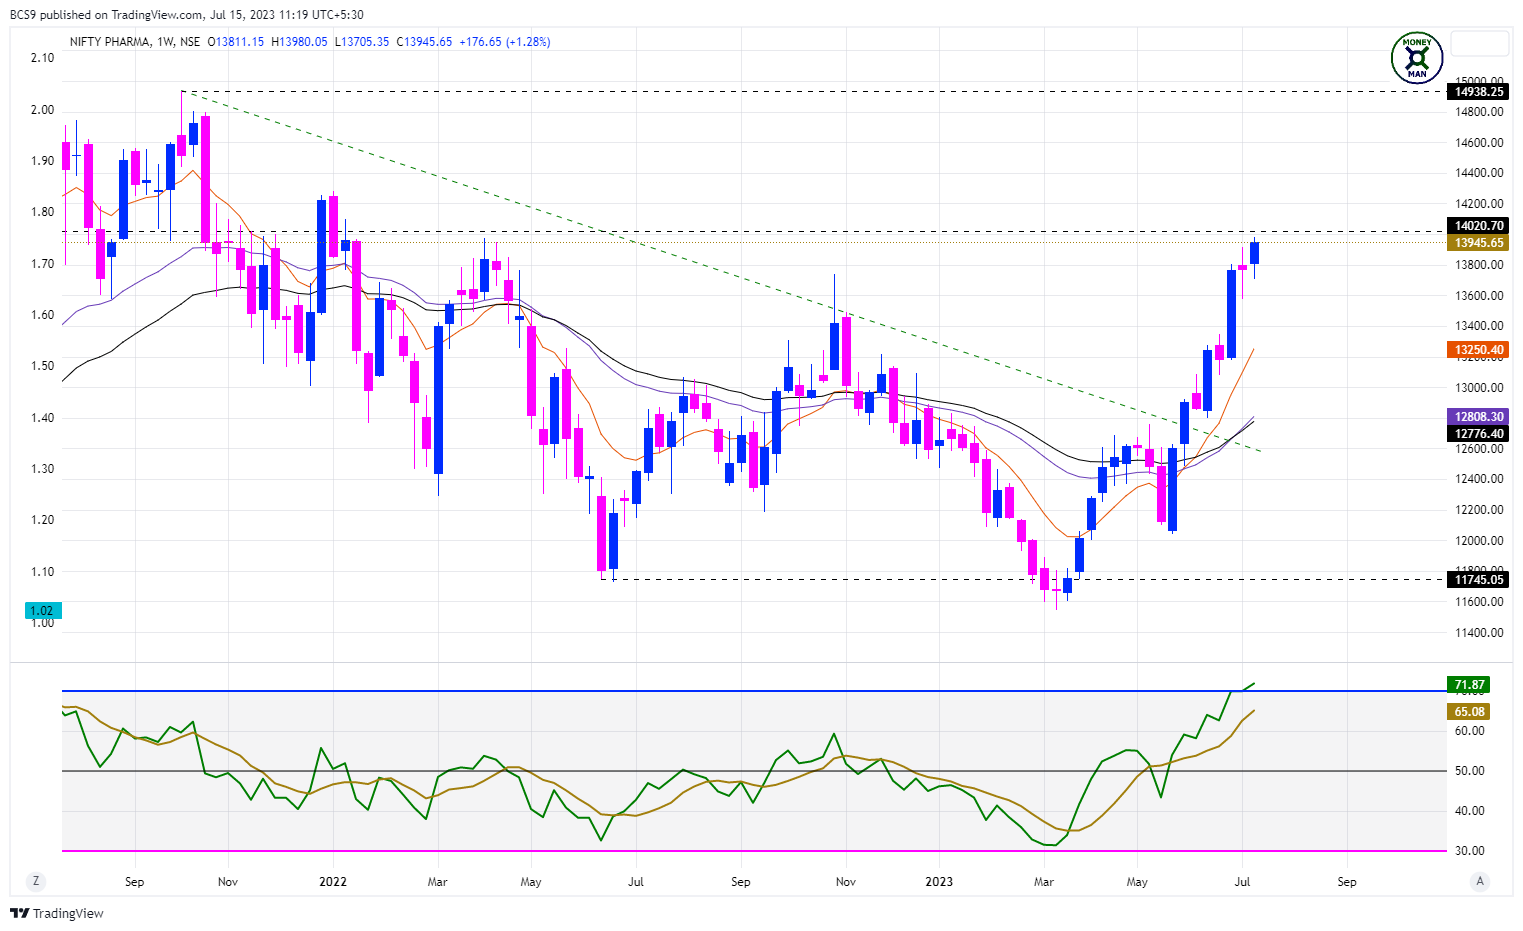
MONEYMAN TREND GUIDE:
Breakout above Consolidation Base: YES
Good Buying Momentum: YES
Stage 2 Advancing Phase: YES (EARLY)
At / Near ATH: NO
At / Near 52 Week Highs: YES
Price Action Structure: HH-HL
OBSERVATIONS:
Strong buying momentum. Weekly RSI over-bought.
FINAL RANKING: B
21. NIFTY PSU BANKS
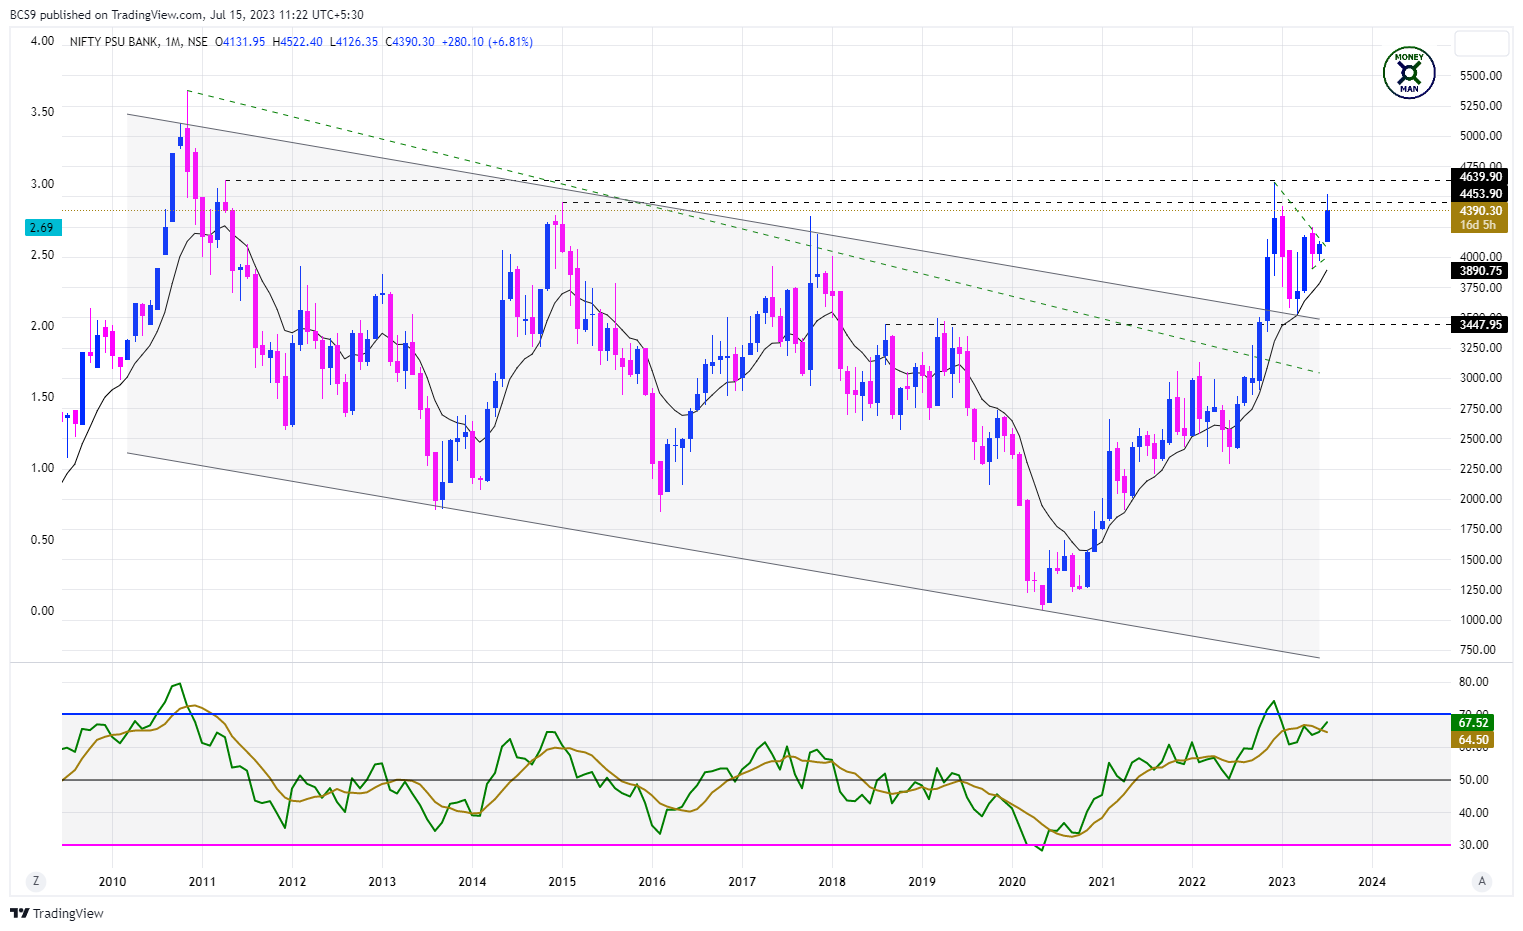
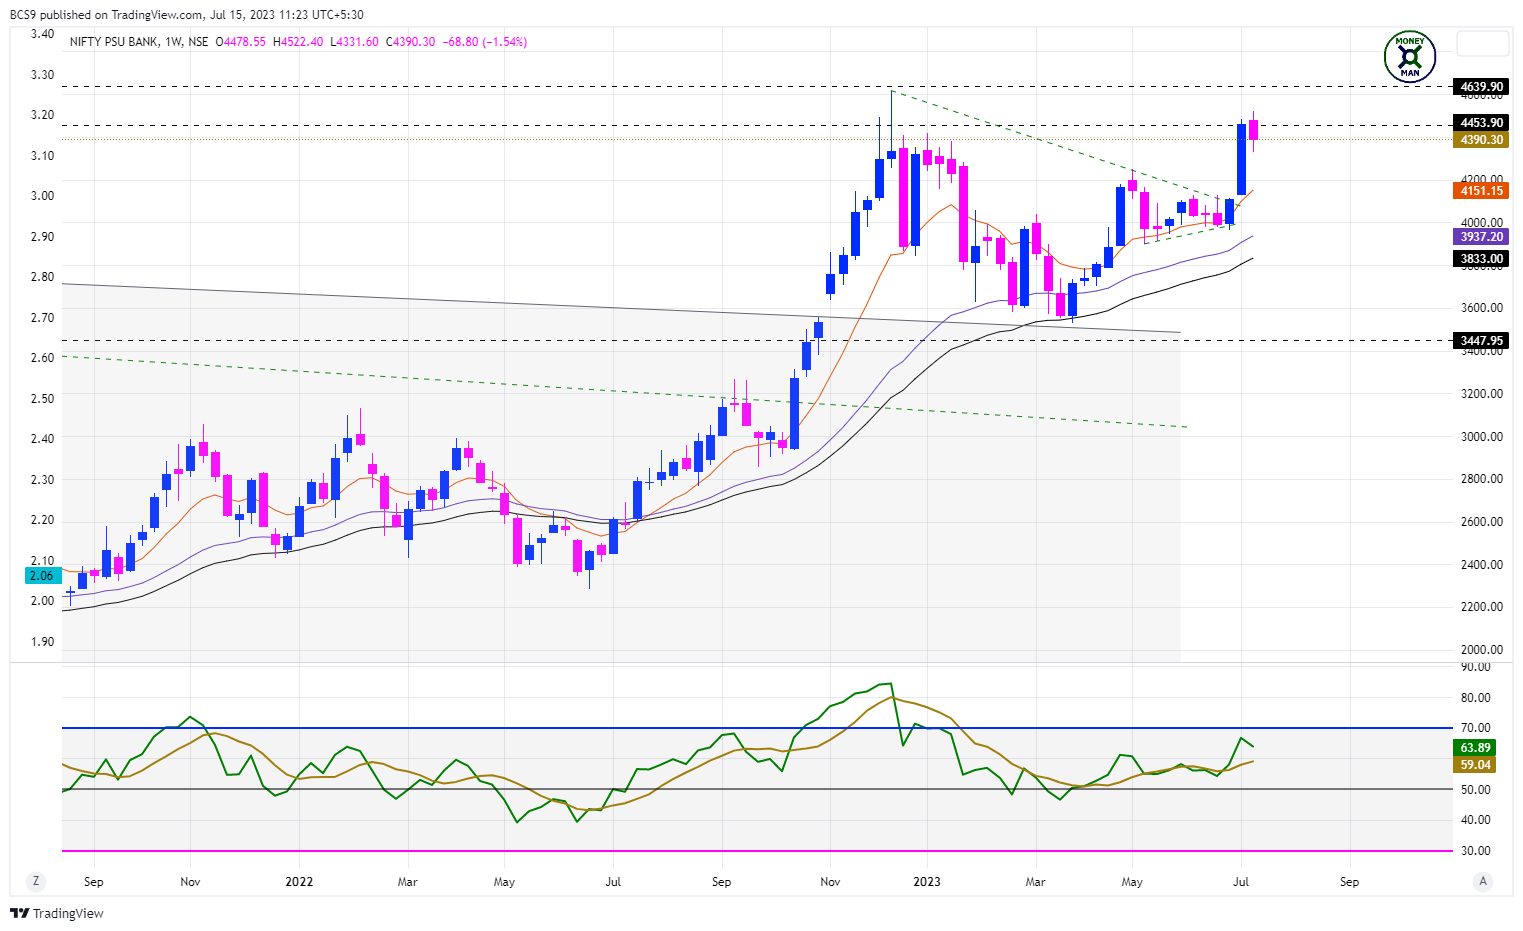
MONEYMAN TREND GUIDE:
Breakout above Consolidation Base: YES
Good Buying Momentum: YES
Stage 2 Advancing Phase: YES
At / Near ATH: NO
At / Near 52 Week Highs: YES
Price Action Structure: UNDER FORMATION
OBSERVATIONS:
Consolidating after a sharp upmove.
FINAL RANKING: A
22. NIFTY PRIVATE BANKS
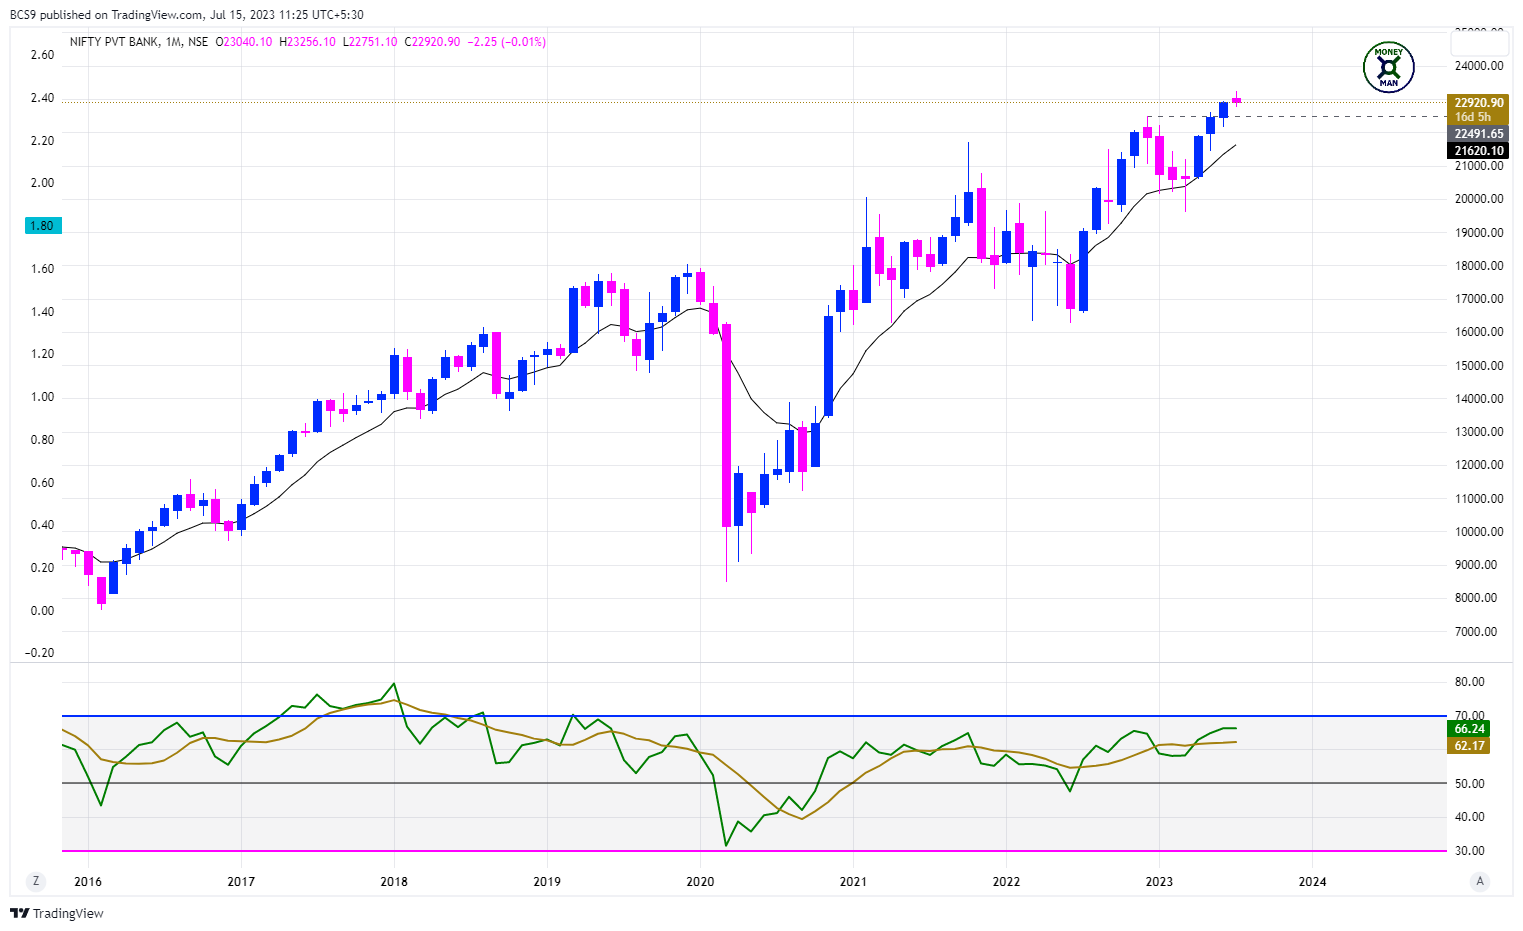
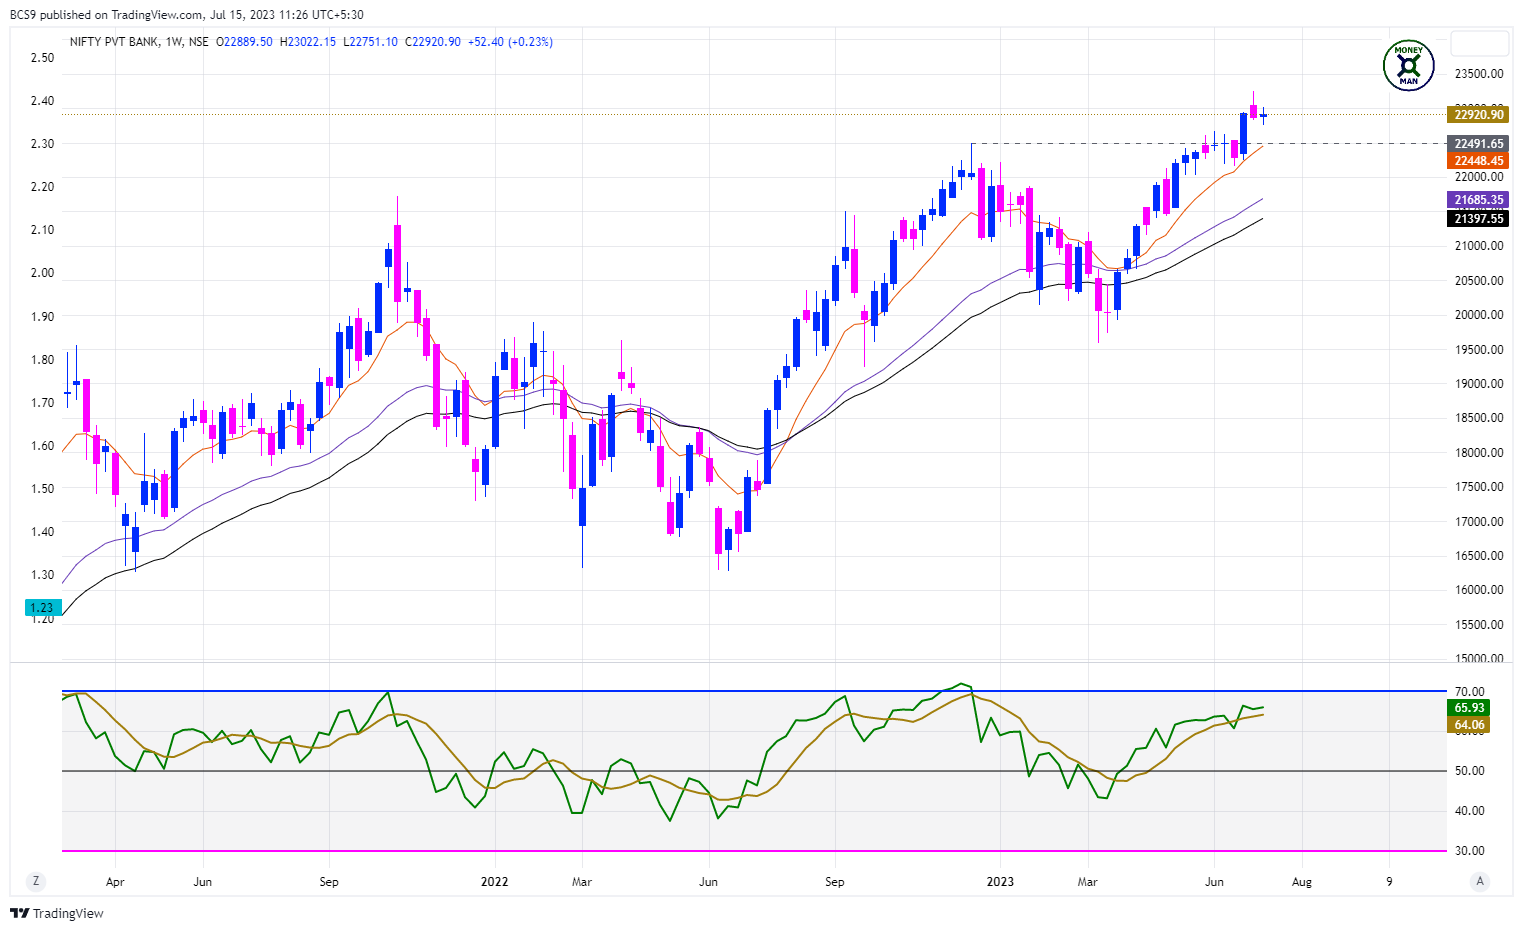
MONEYMAN TREND GUIDE:
Breakout above Consolidation Base: YES
Good Buying Momentum: YES
Stage 2 Advancing Phase: YES
At / Near ATH: YES
At / Near 52 Week Highs: YES
Price Action Structure: HH-HL
OBSERVATIONS:
Consolidating after a sharp upmove.
FINAL RANKING: A
23. NIFTY REALTY
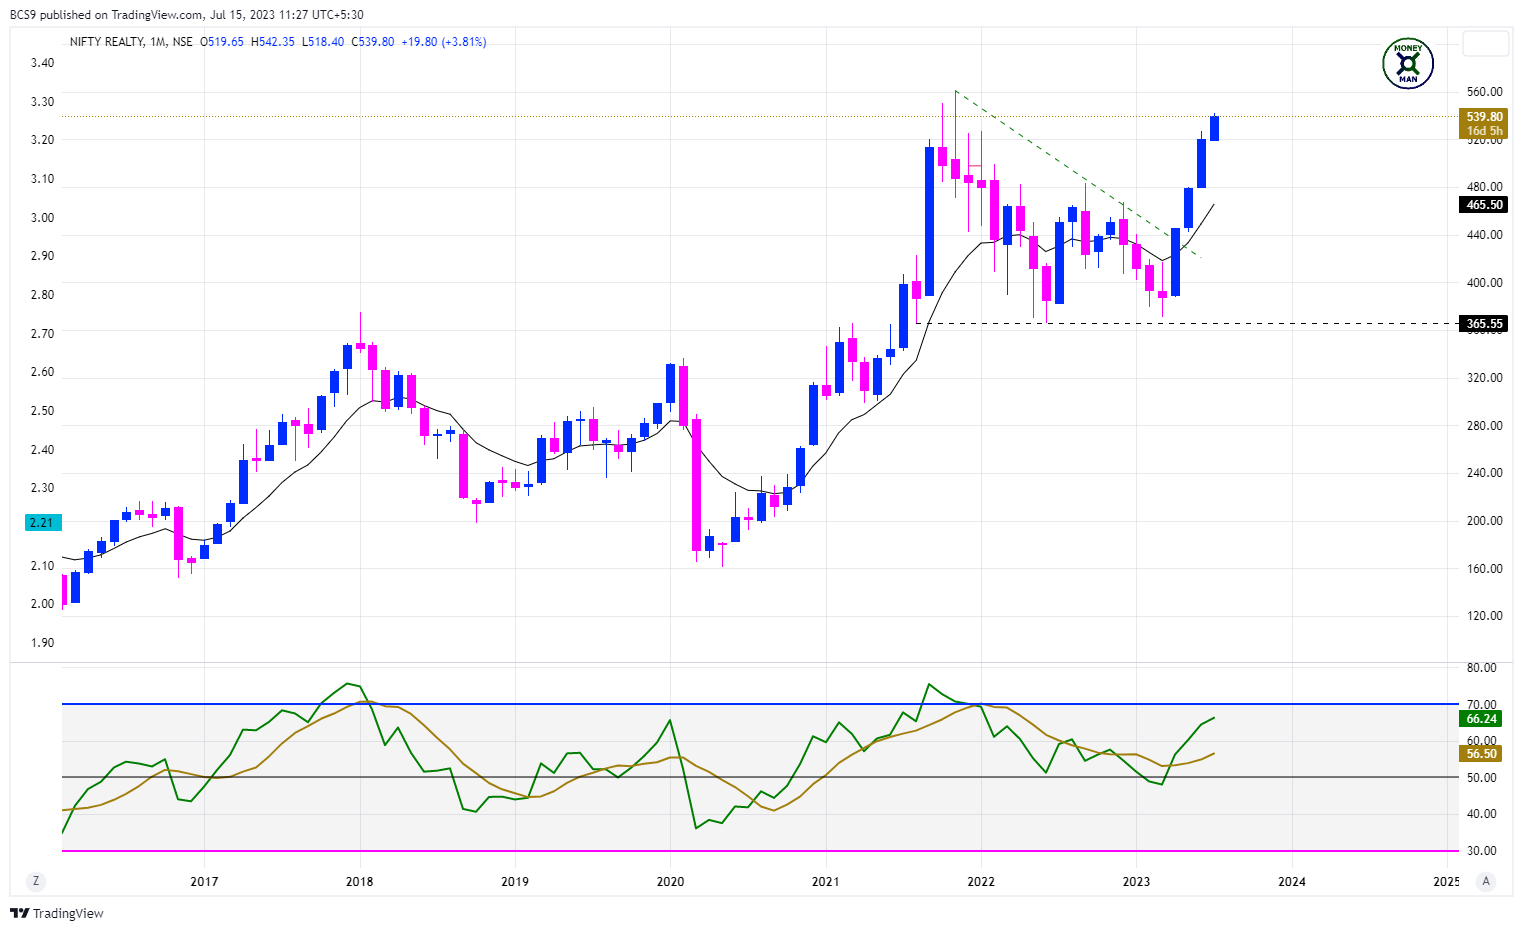
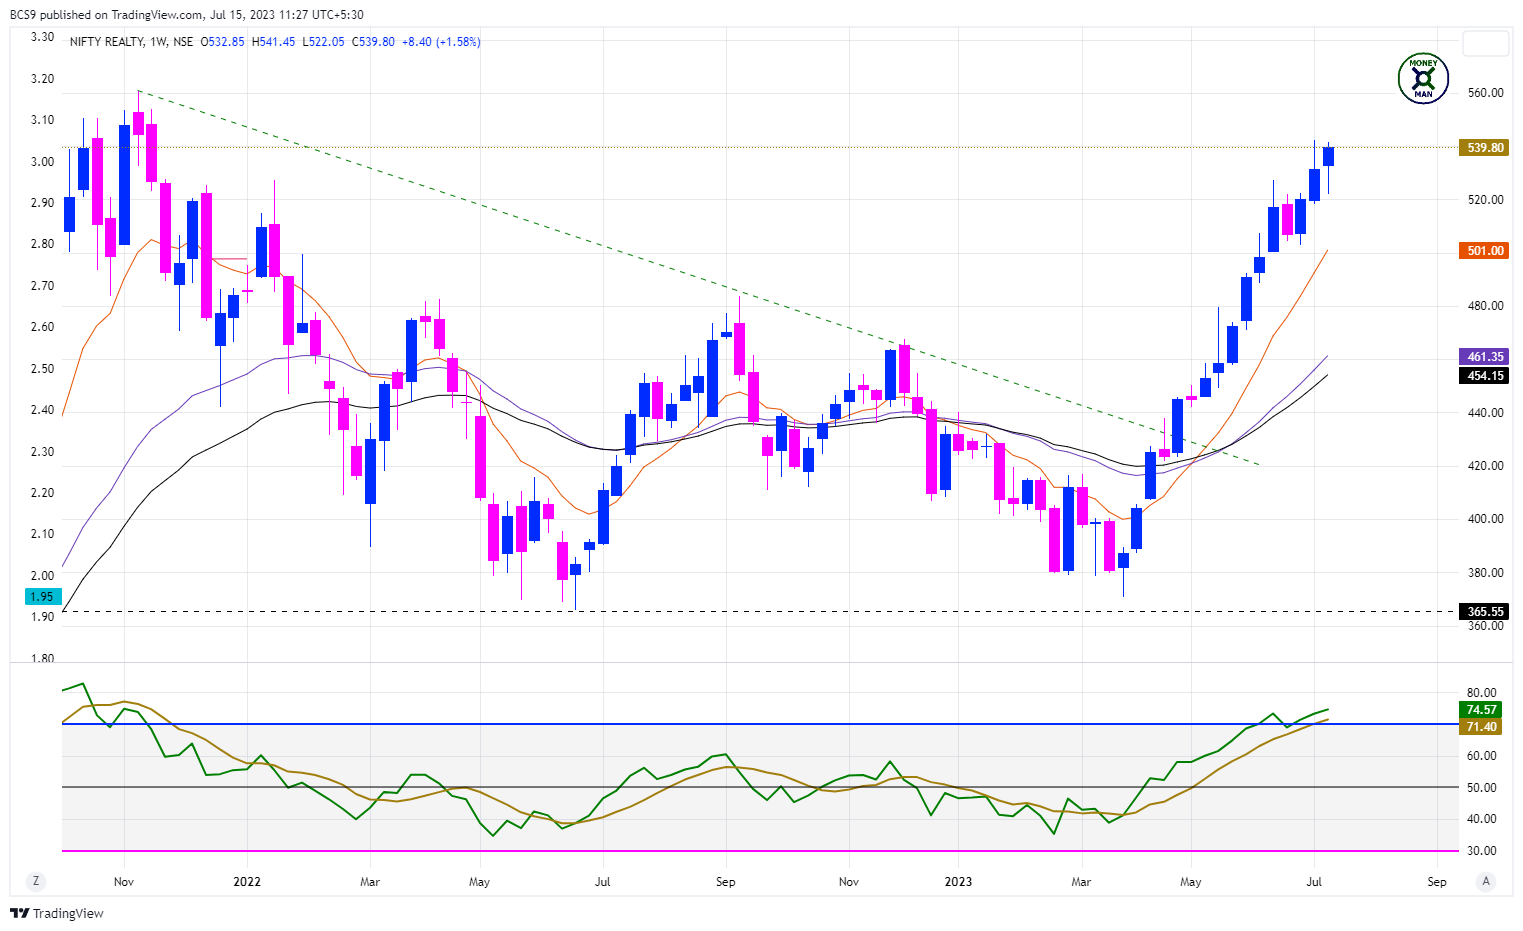
MONEYMAN TREND GUIDE:
Breakout above Consolidation Base: YES
Good Buying Momentum: YES
Stage 2 Advancing Phase: YES
At / Near ATH: NO
At / Near 52 Week Highs: YES
Price Action Structure: HH-HL
OBSERVATIONS:
Strong momentum. Weekly RSI in over-bought zone but also making new highs. Moves are getting extended.
FINAL RANKING: C
SUMMARY
A: Good For Deployment
BANKNIFTY, COMMODITIES, CONSUMER DURABLES, CPSE, FINANCIAL SERVICES, PSU BANKS, PRIVATE BANKS.
B: Under Watch
NIFTY, NIFTY500, MIDCAPS, SMALLCAPS, CONSUMPTION, HEALTHCARE, INFRA, IT, METAL, PHARMA.
C: Avoid / Book Profits
AUTO, ENERGY, FMCG, MEDIA, OIL & GAS, REALTY.
Now, all I need to do is to just focus on the sectors looking good and the ETFs representing those sectors.
This study also helps me to keep the best sectors at the top of my mind so that, when I am selecting individual stocks, I can select them from the best sectors only.
ANNEXURE
The following are the deployment proxies (ETF only) for the various sectors’ sub-indices:
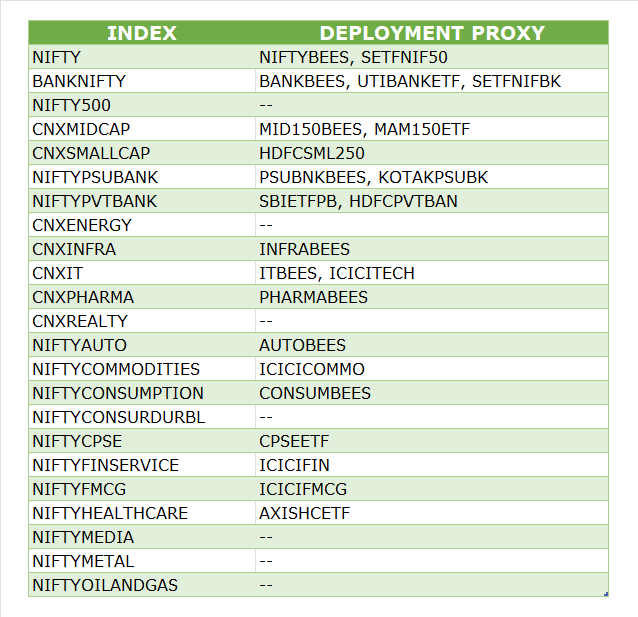
NB: Only the ones with highest liquidity taken in this list. Some of the indices don’t have an ETF yet.
NOTE:
The 1st chart is on a monthly time frame and the 2nd chart is on a weekly time frame.
Moving Averages used:
Monthly frame - 10 Monthly EMA (Black).
Weekly frame - 10 Weekly EMA (Orange), 30 Weekly EMA (Purple) & 40 Weekly EMA (Black)
DISCLAIMER:
All information provided here is for educational purposes only and does not constitute any investment advice or recommendation. Please do your own due diligence. Products mentioned are just representative in nature and not recommendations. There is no financial incentive to write about any particular Stock / AMC / ETF. All data taken is the latest to the best of my knowledge.